Kyoto Cherry Blossom Blooms
This plot is one of my contributions to the #30DayChartChallenge Twitter data visualization challenge.
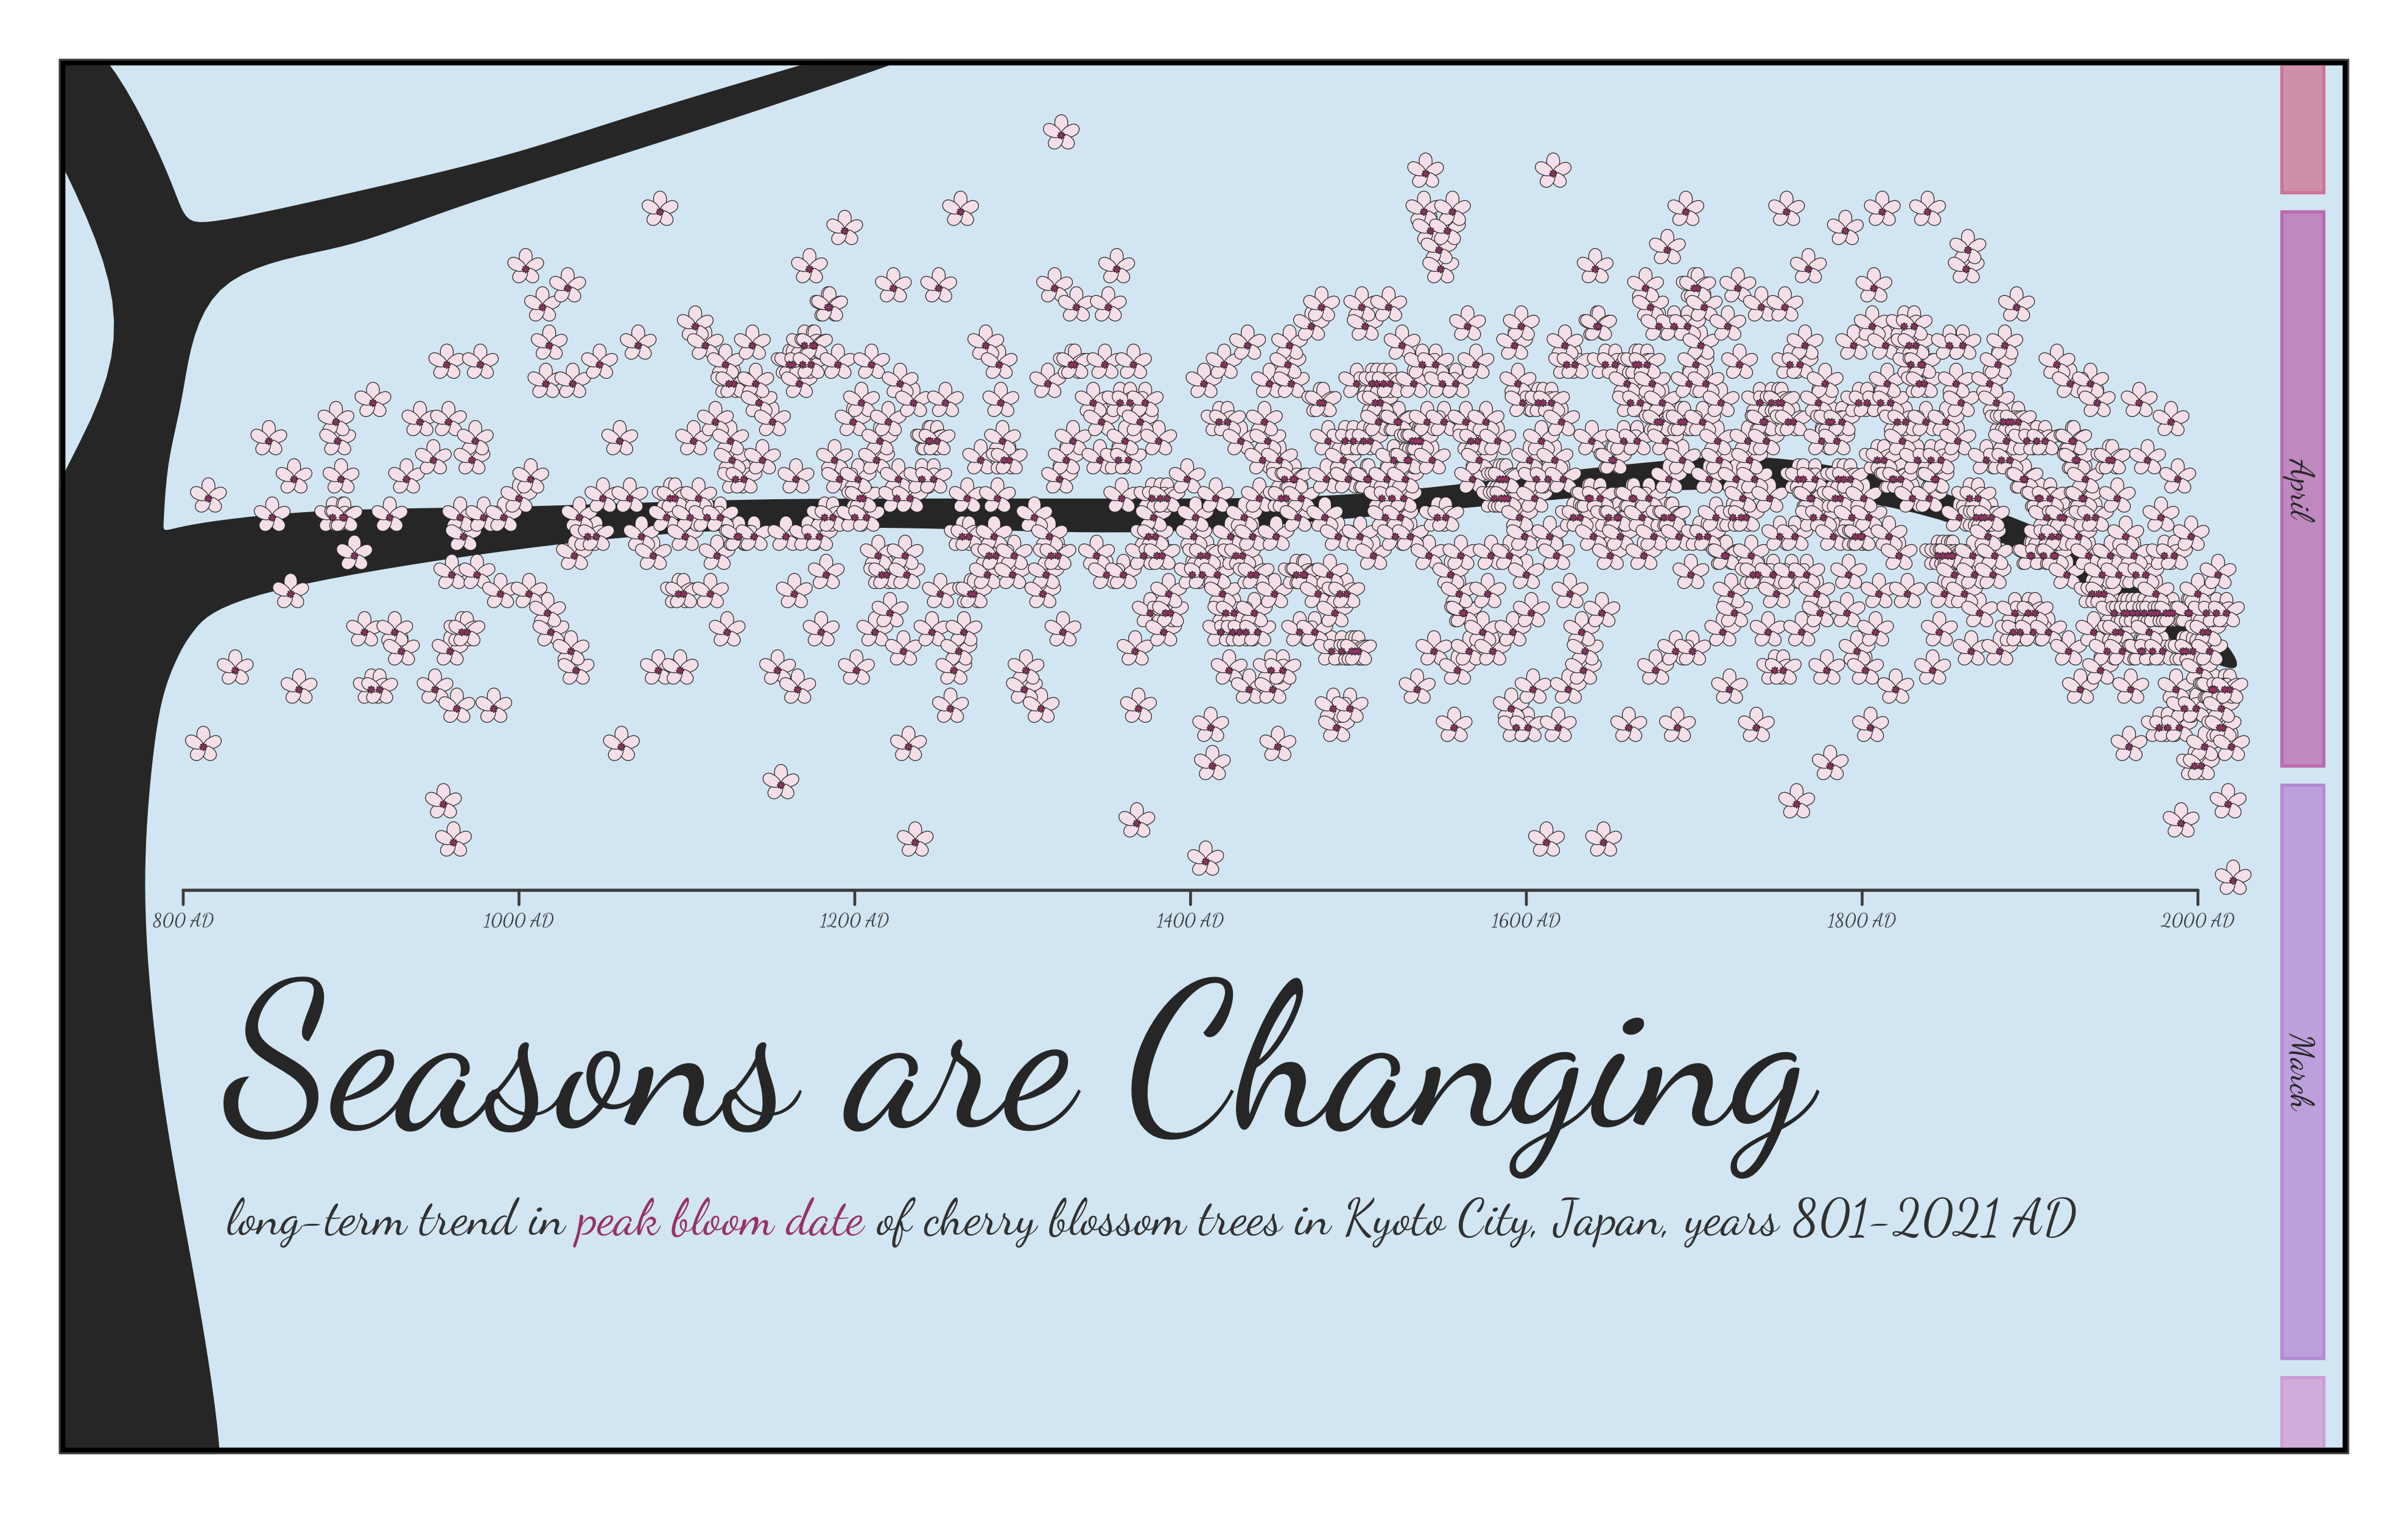
The prompt on this day was global change, so I plotted the timing of cherry blossom blooms in Kyoto City, Japan for over 1000 years. Here, I used the ggforce package to turn individual points into flowers and a trend line into a tree branch.
Code available at link in sidebar.