making science useful
transforming data into dashboards, graphics, & decision-making tools
BioShiftR
An R package for species' range shift data access and hypothesis testing
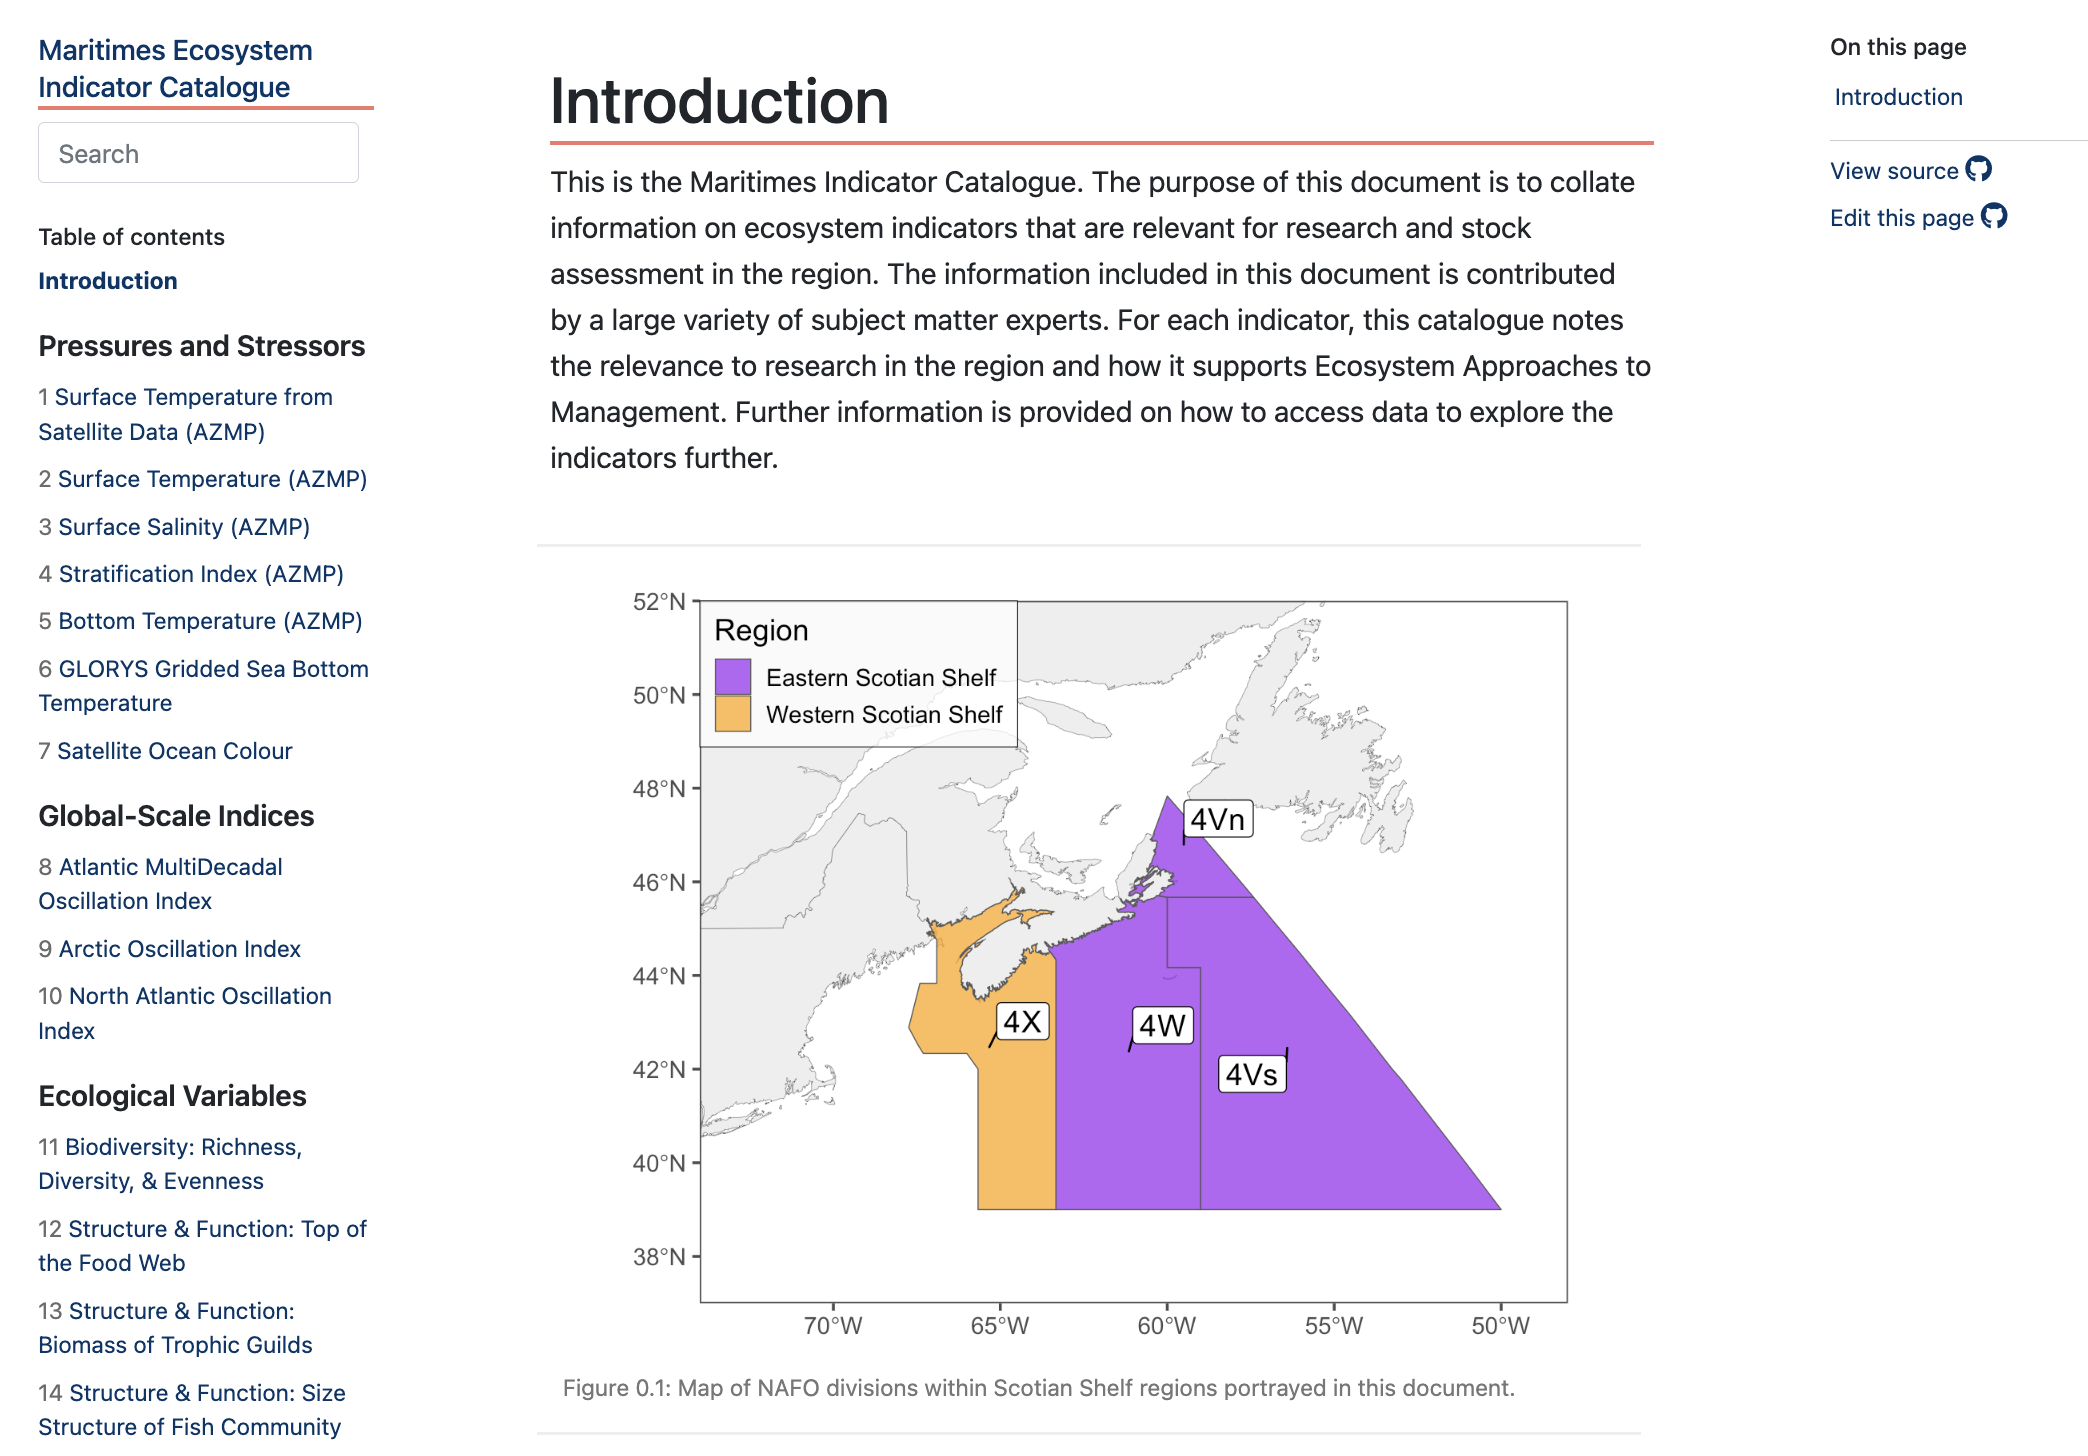
Maritimes Indicator data catalogue
Interactive technical document for Canadian Atlantic ecosystem data from `marea` R package
BioDivPoweR
An R package for power analysis of biodiversity monitoring schemes
Climate Actions in Canada's Oceans
Recommendations for climate change adaptation policies in Canada
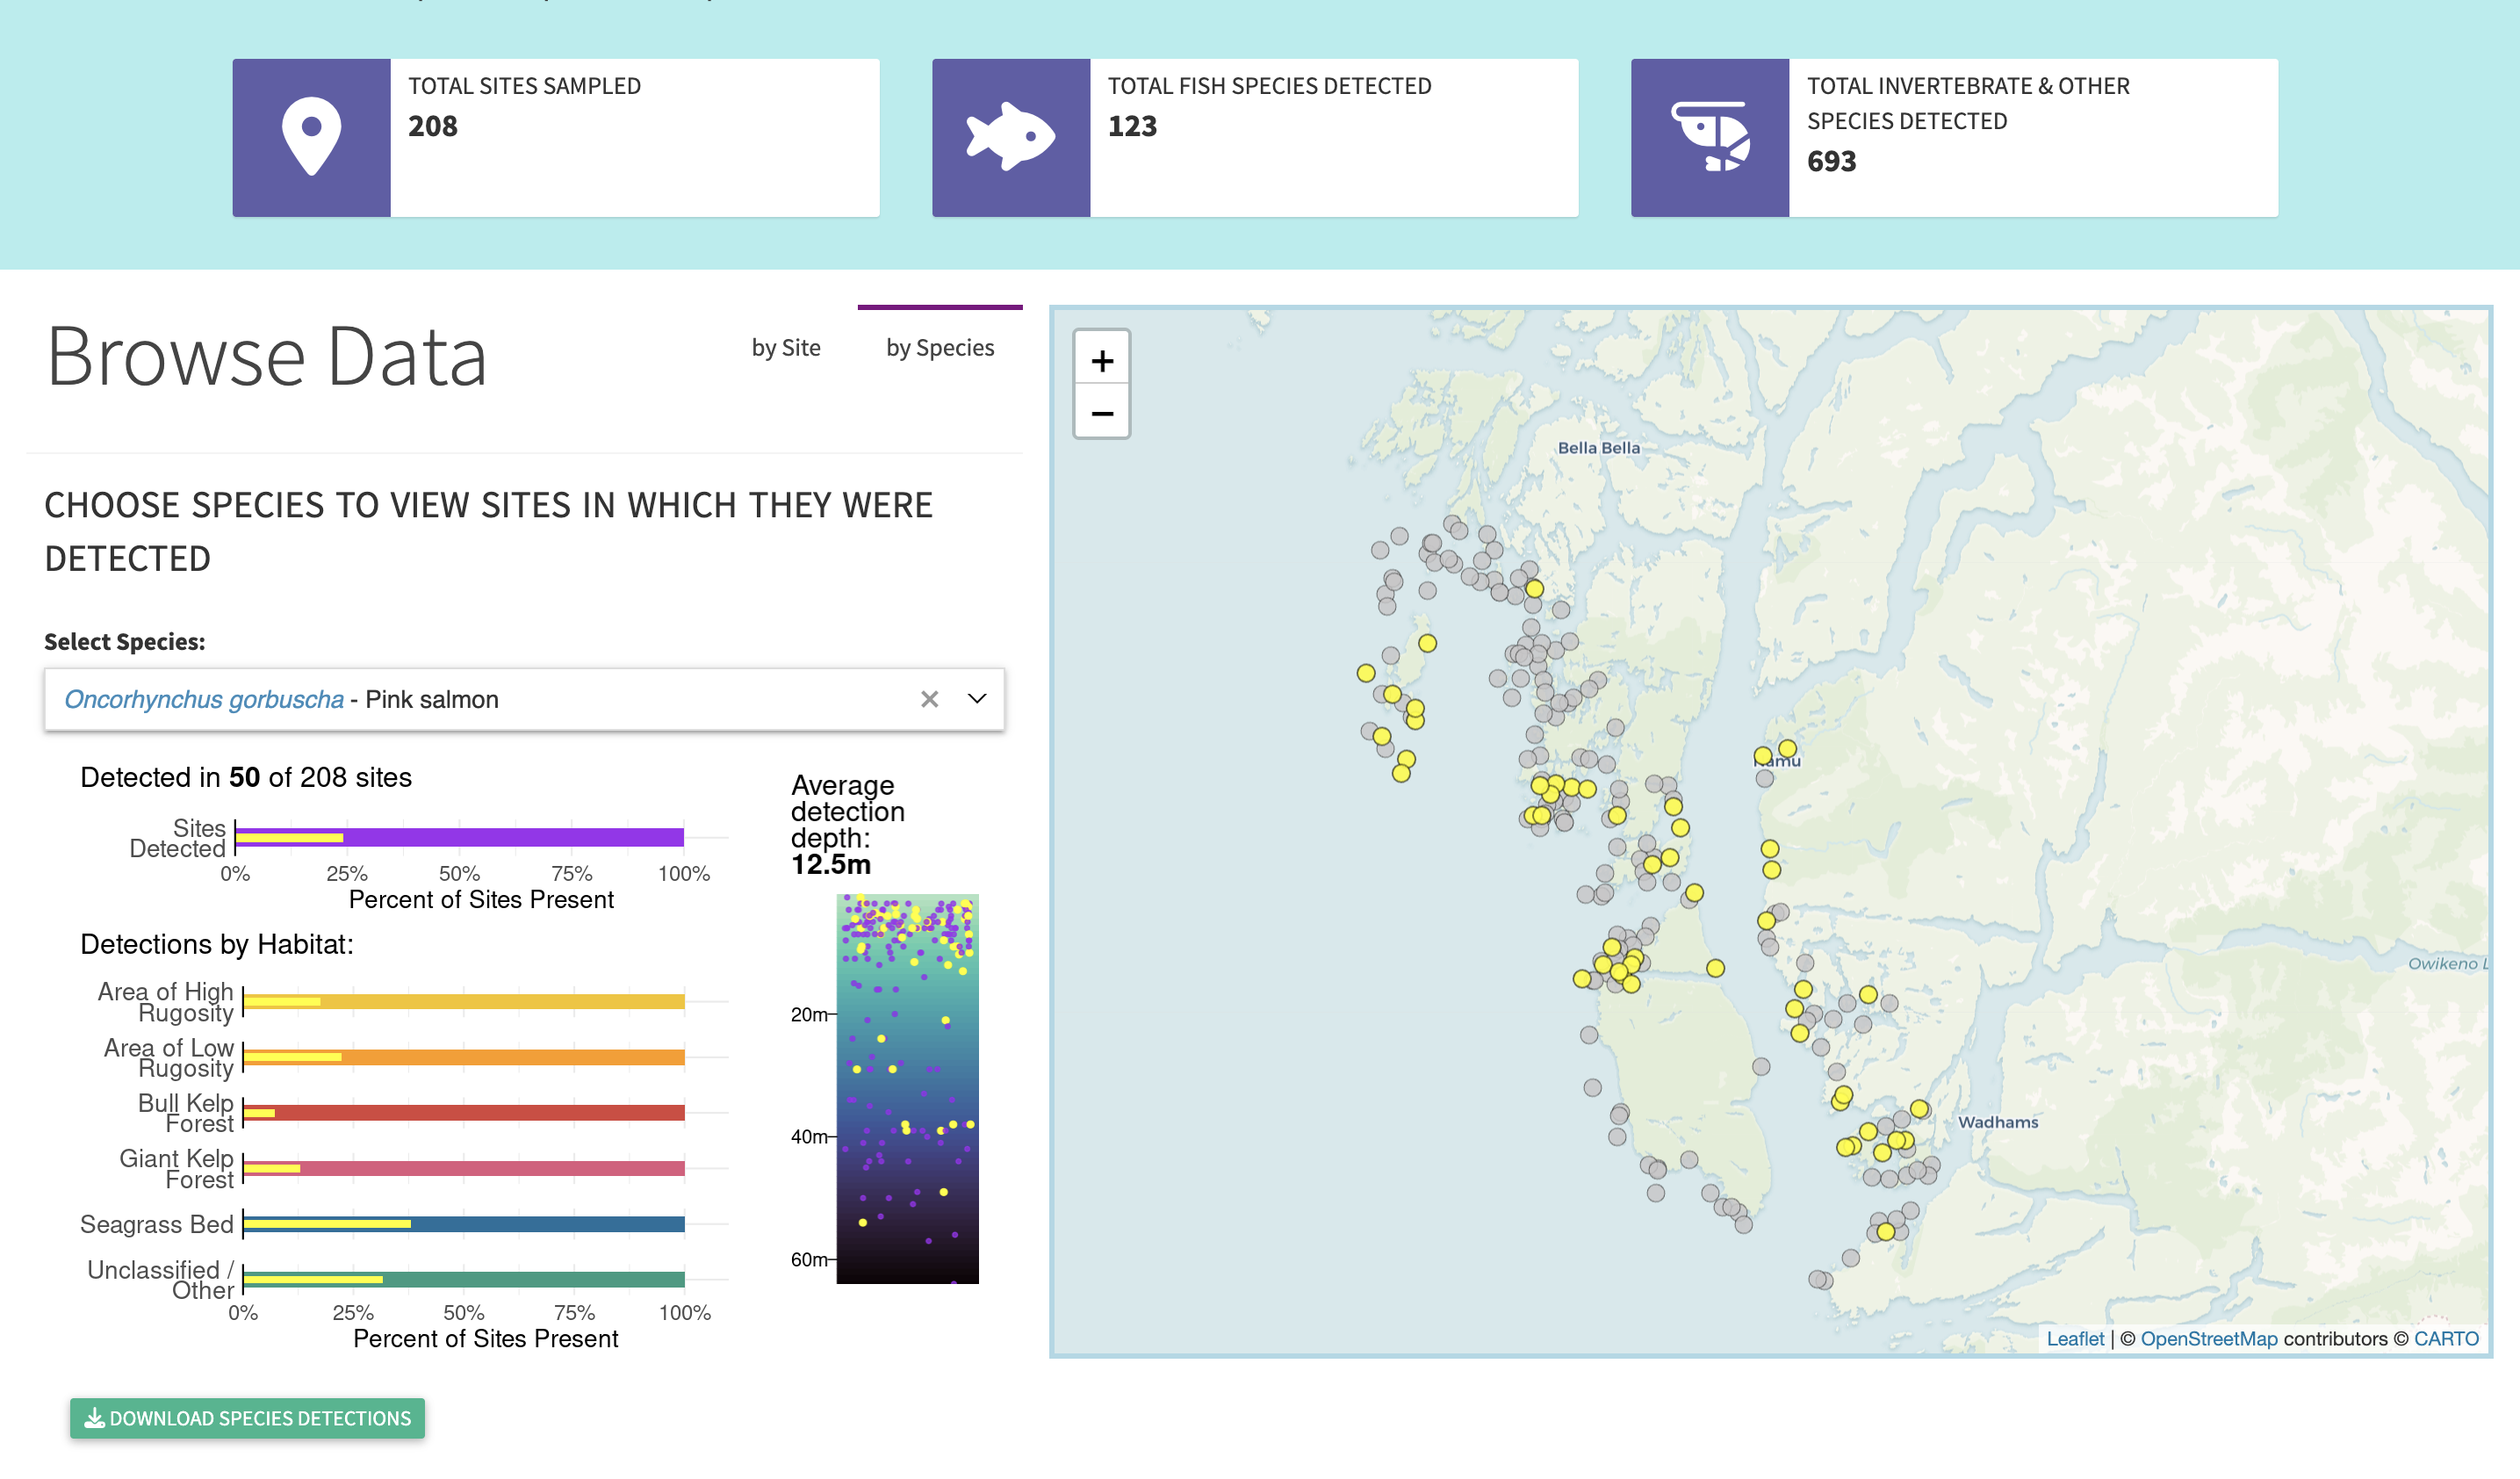
Project Optimize Data Explorer
An interactive dashboard for exploring eDNA detection data from samples in British Columbia
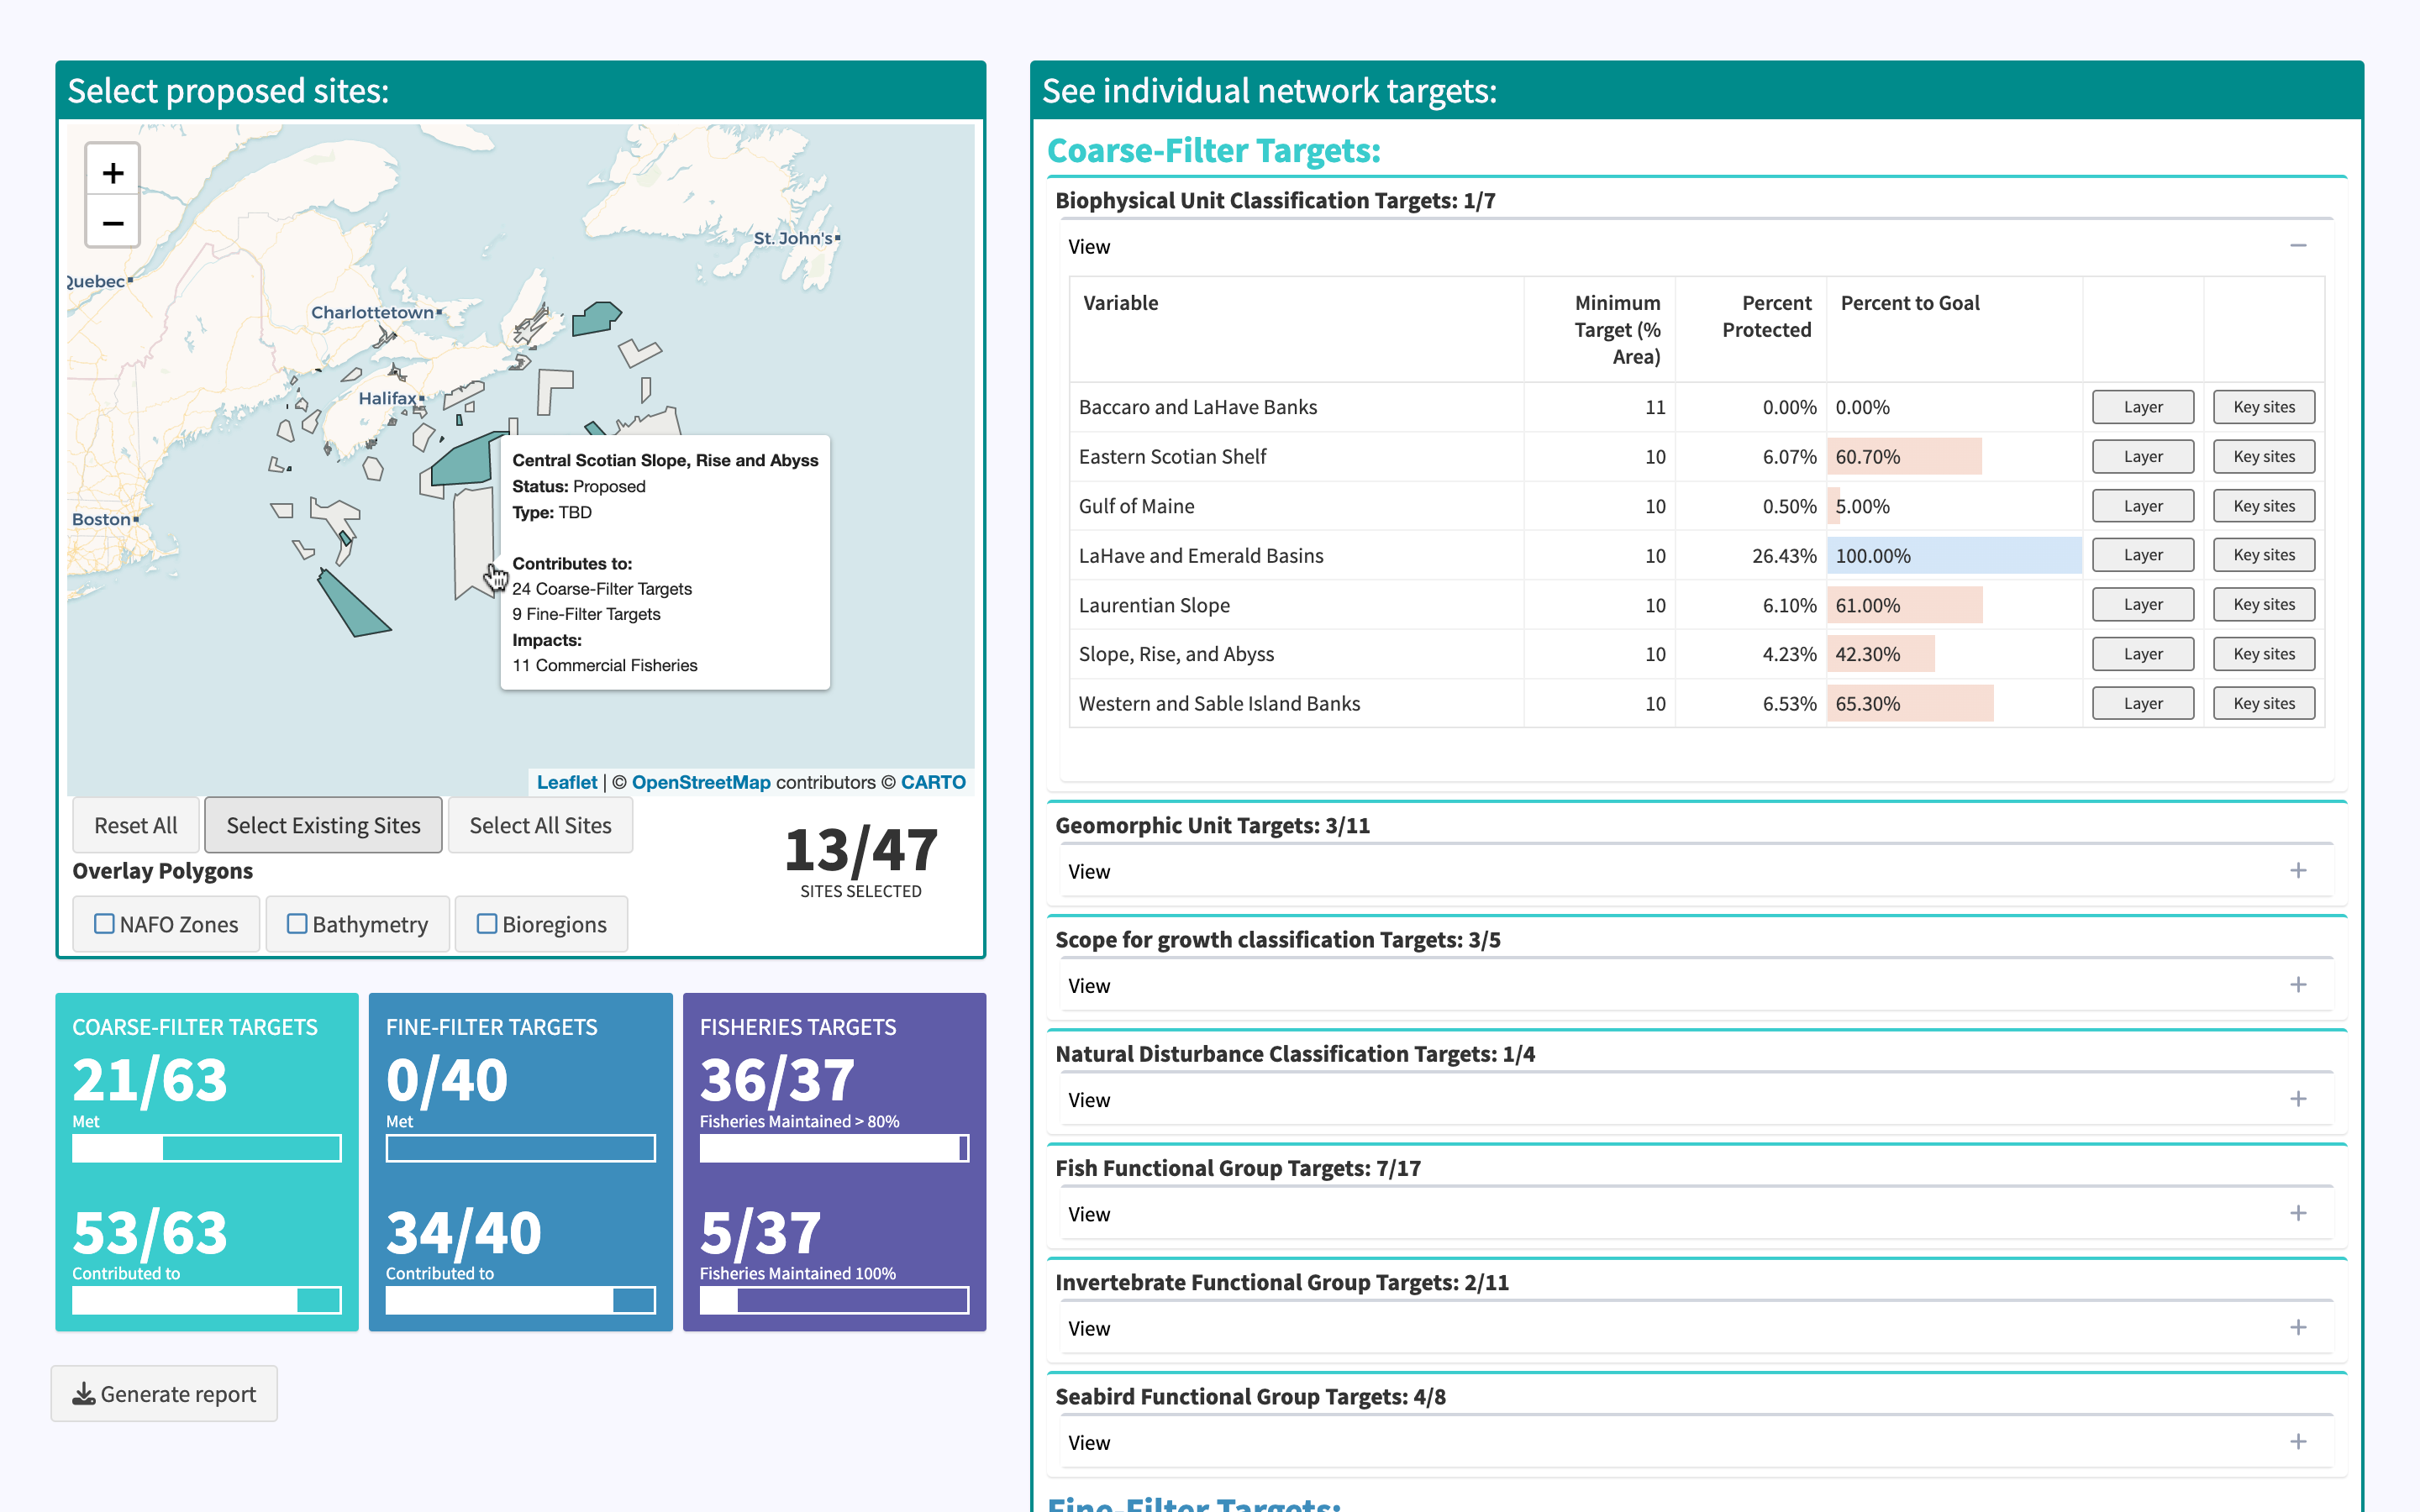
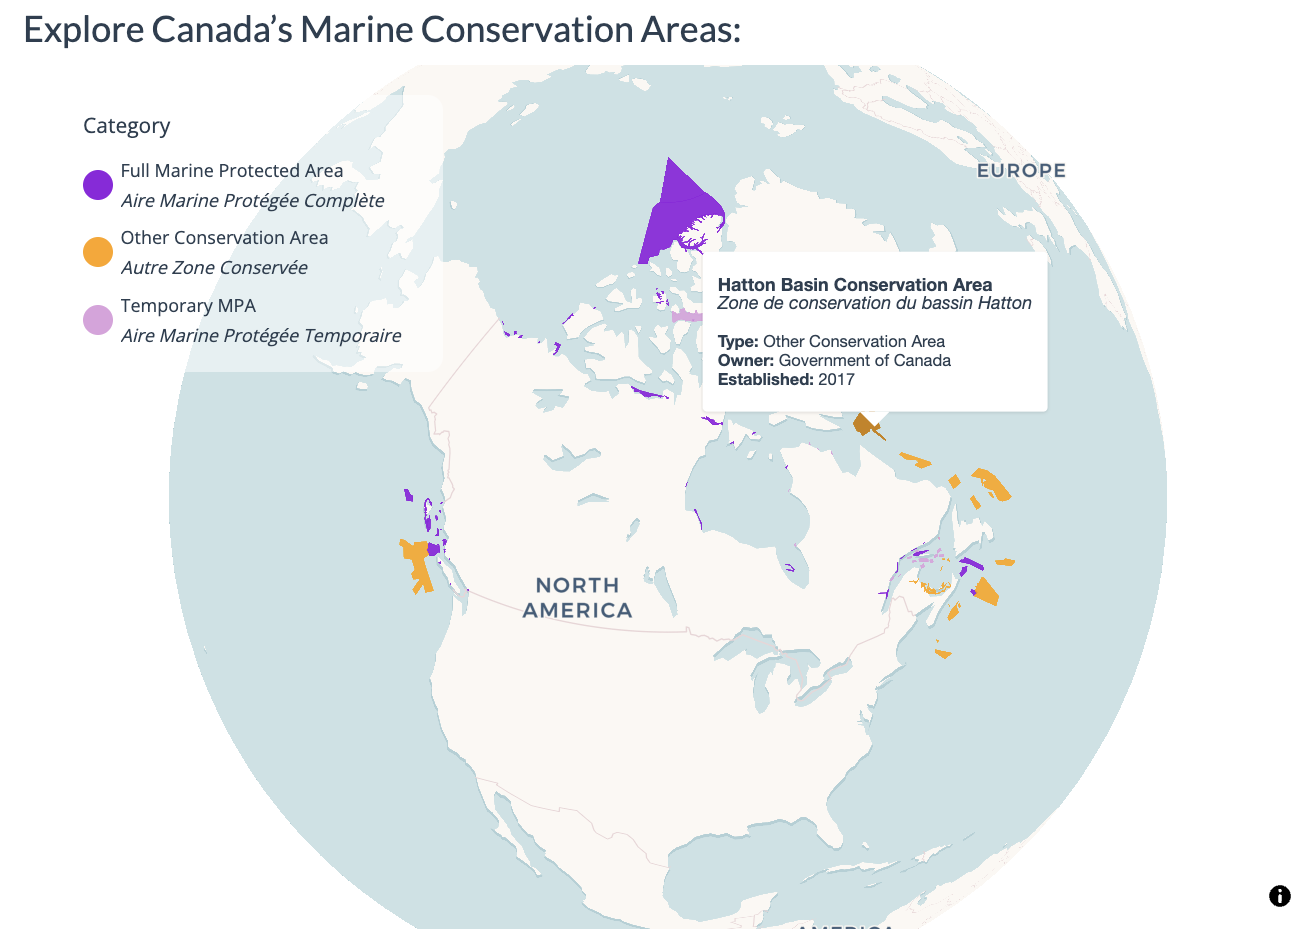
Marine Protected Area Shiny App
An interactive dashboard for scenario-testing protected area implementation in Atlantic Canada
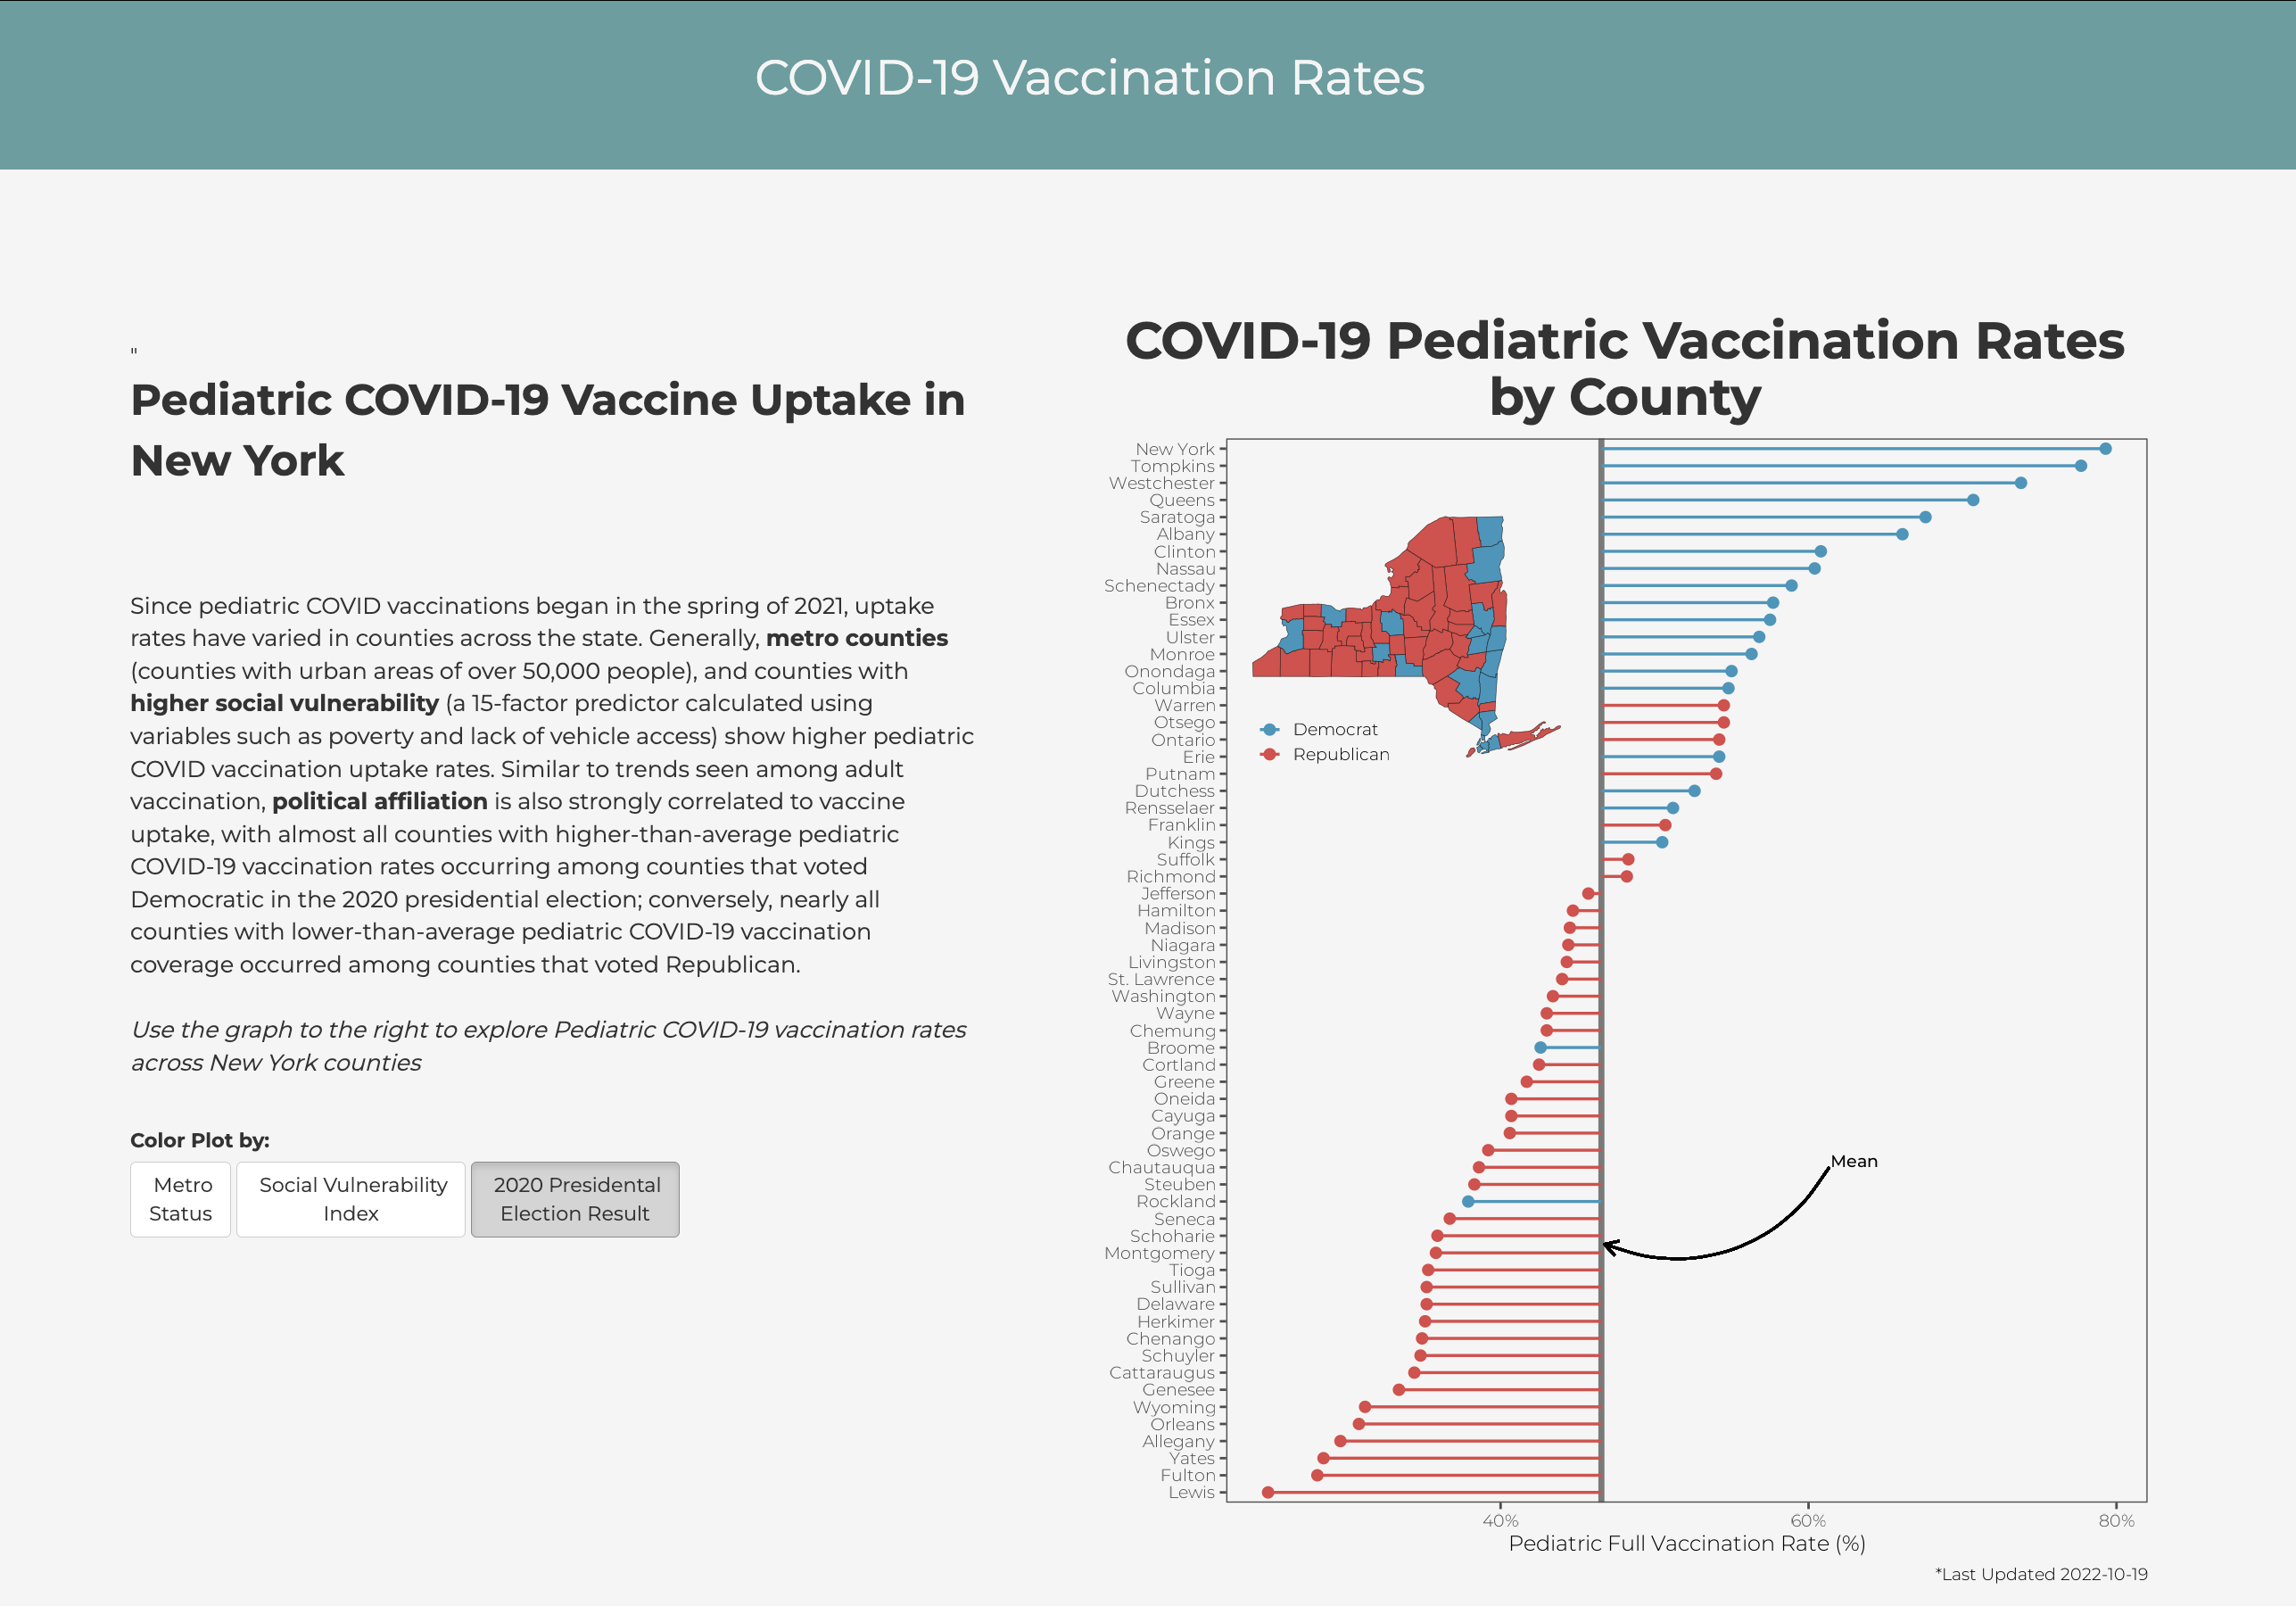
Vaccine Hesitancy Interactive Article
Data article exploring demographic predictors of vaccine uptake in New York State.
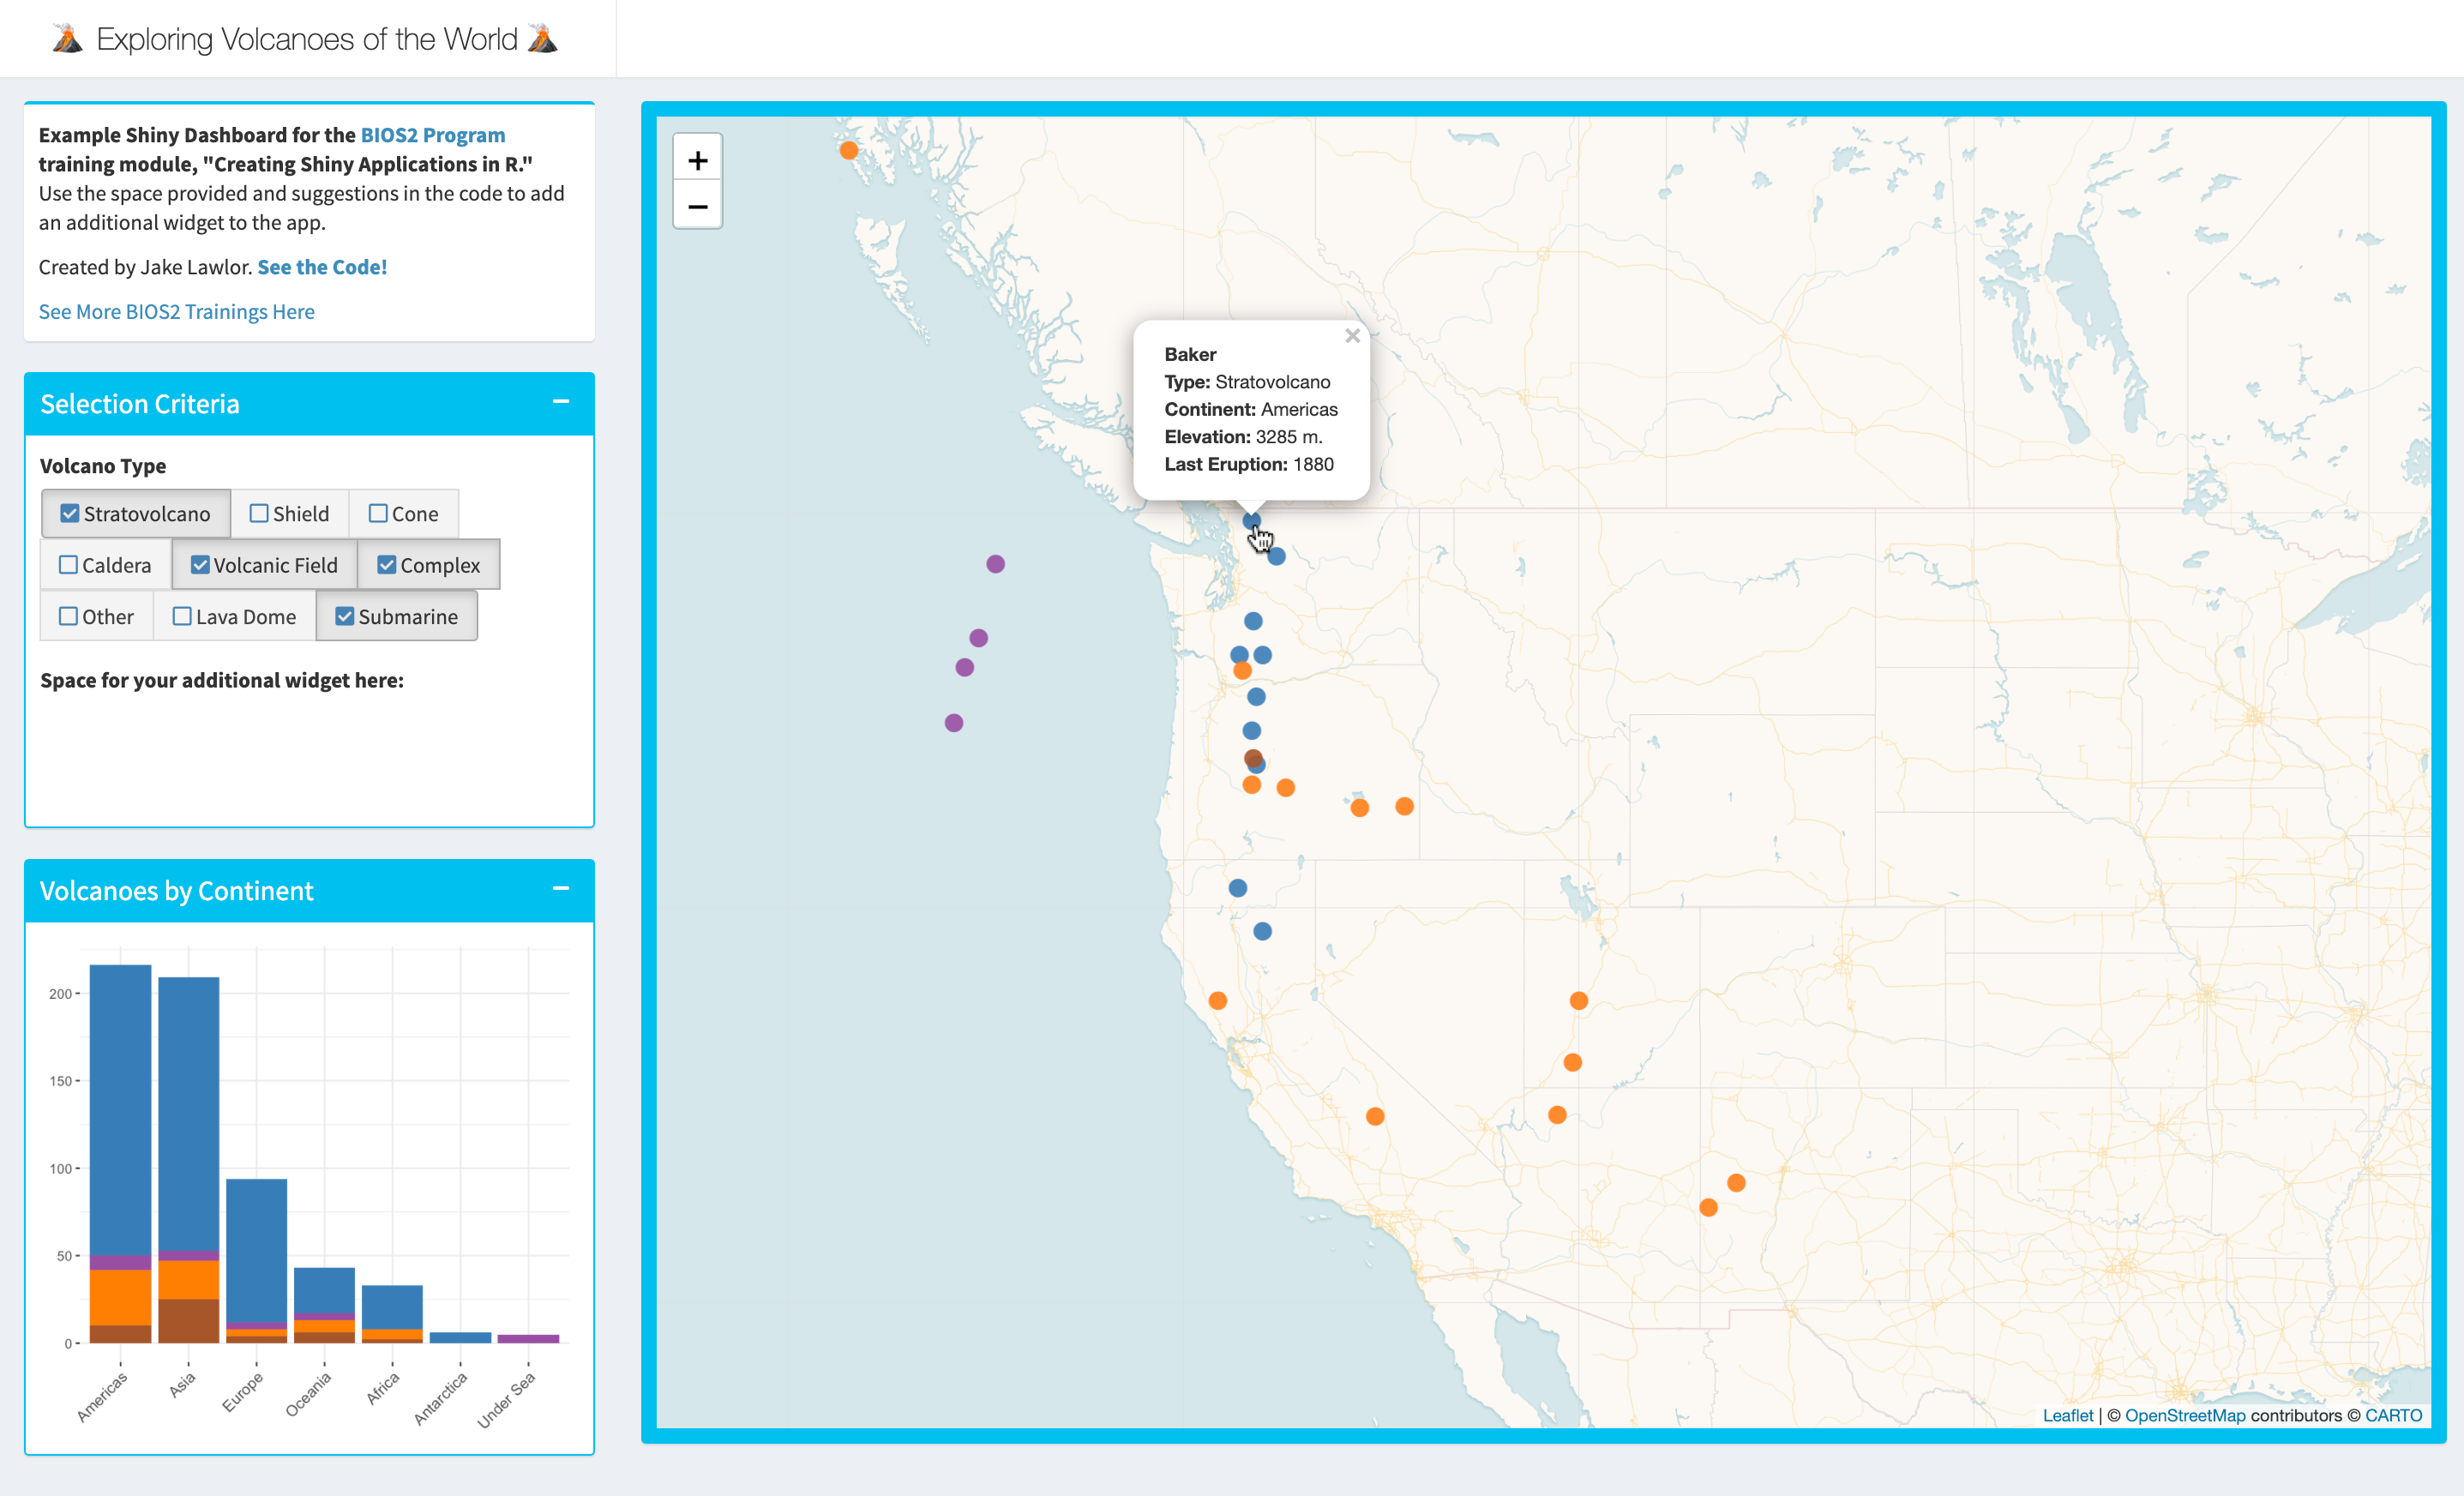
Shiny Tutorial
Tutorial for creating and editing interactive web applications through R Shiny
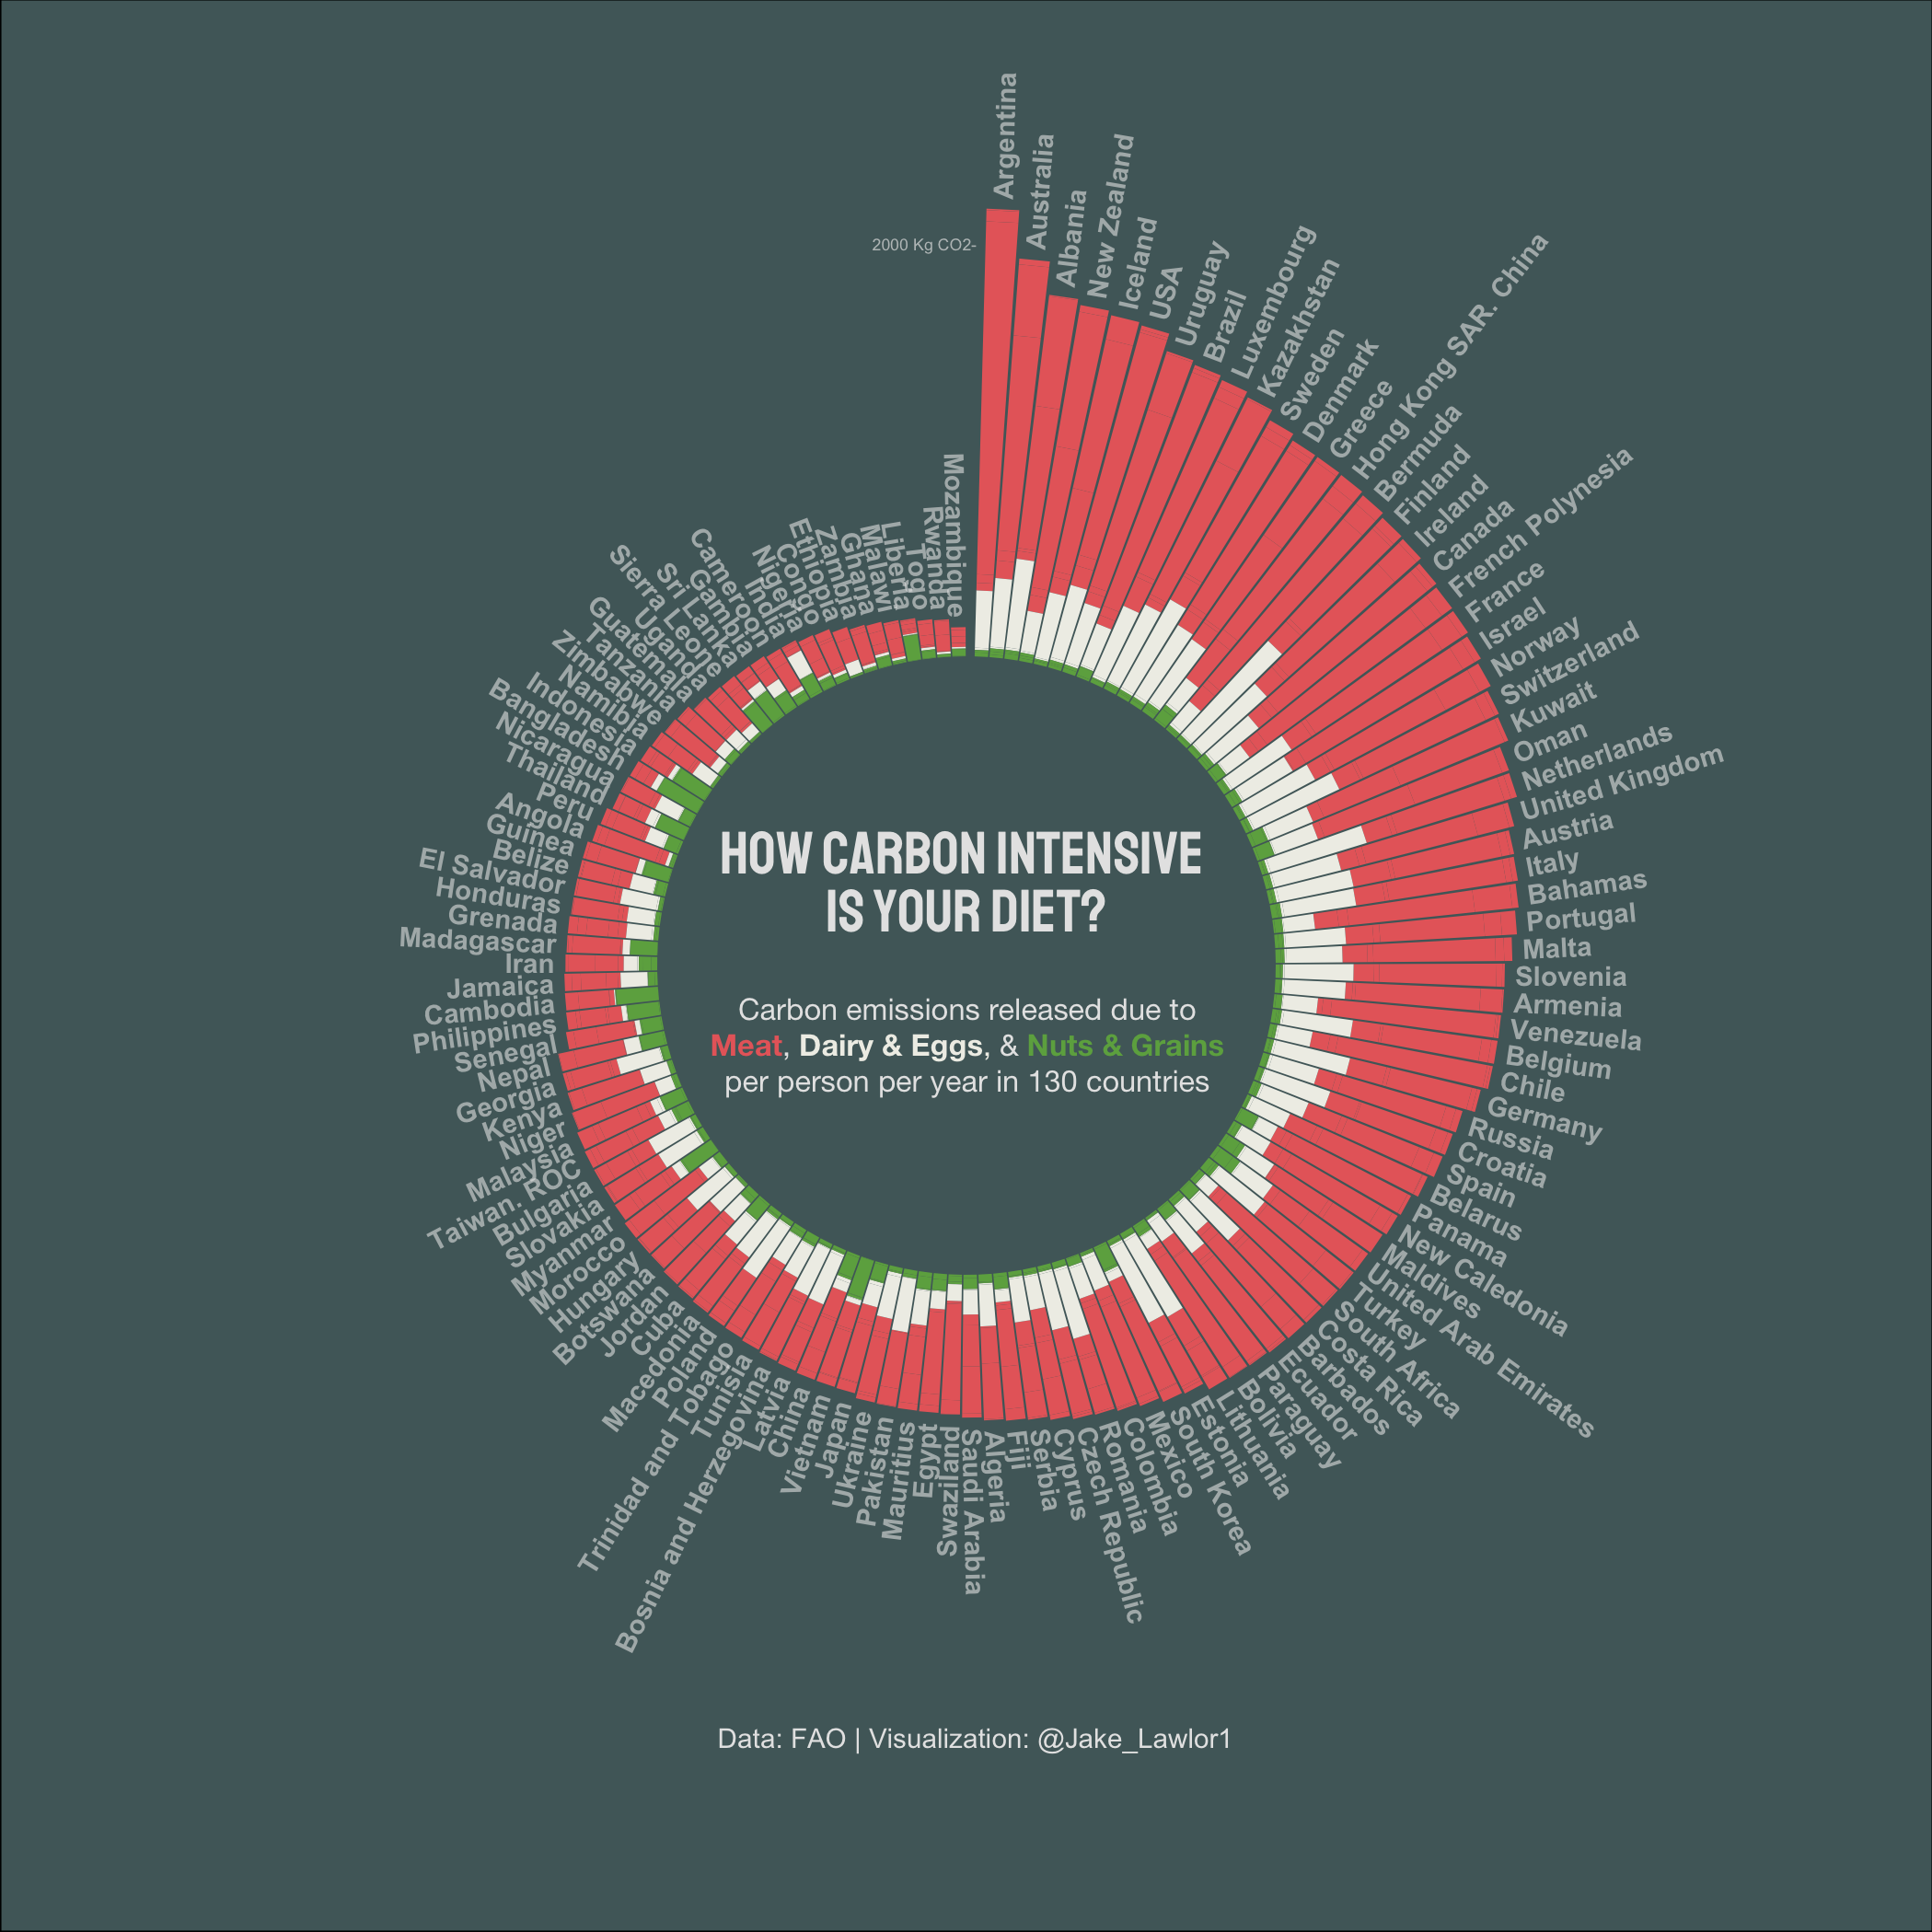
TidyTuesday Contributions
Just-for-fun data visualization projects as part of the #TidyTuesday R community project
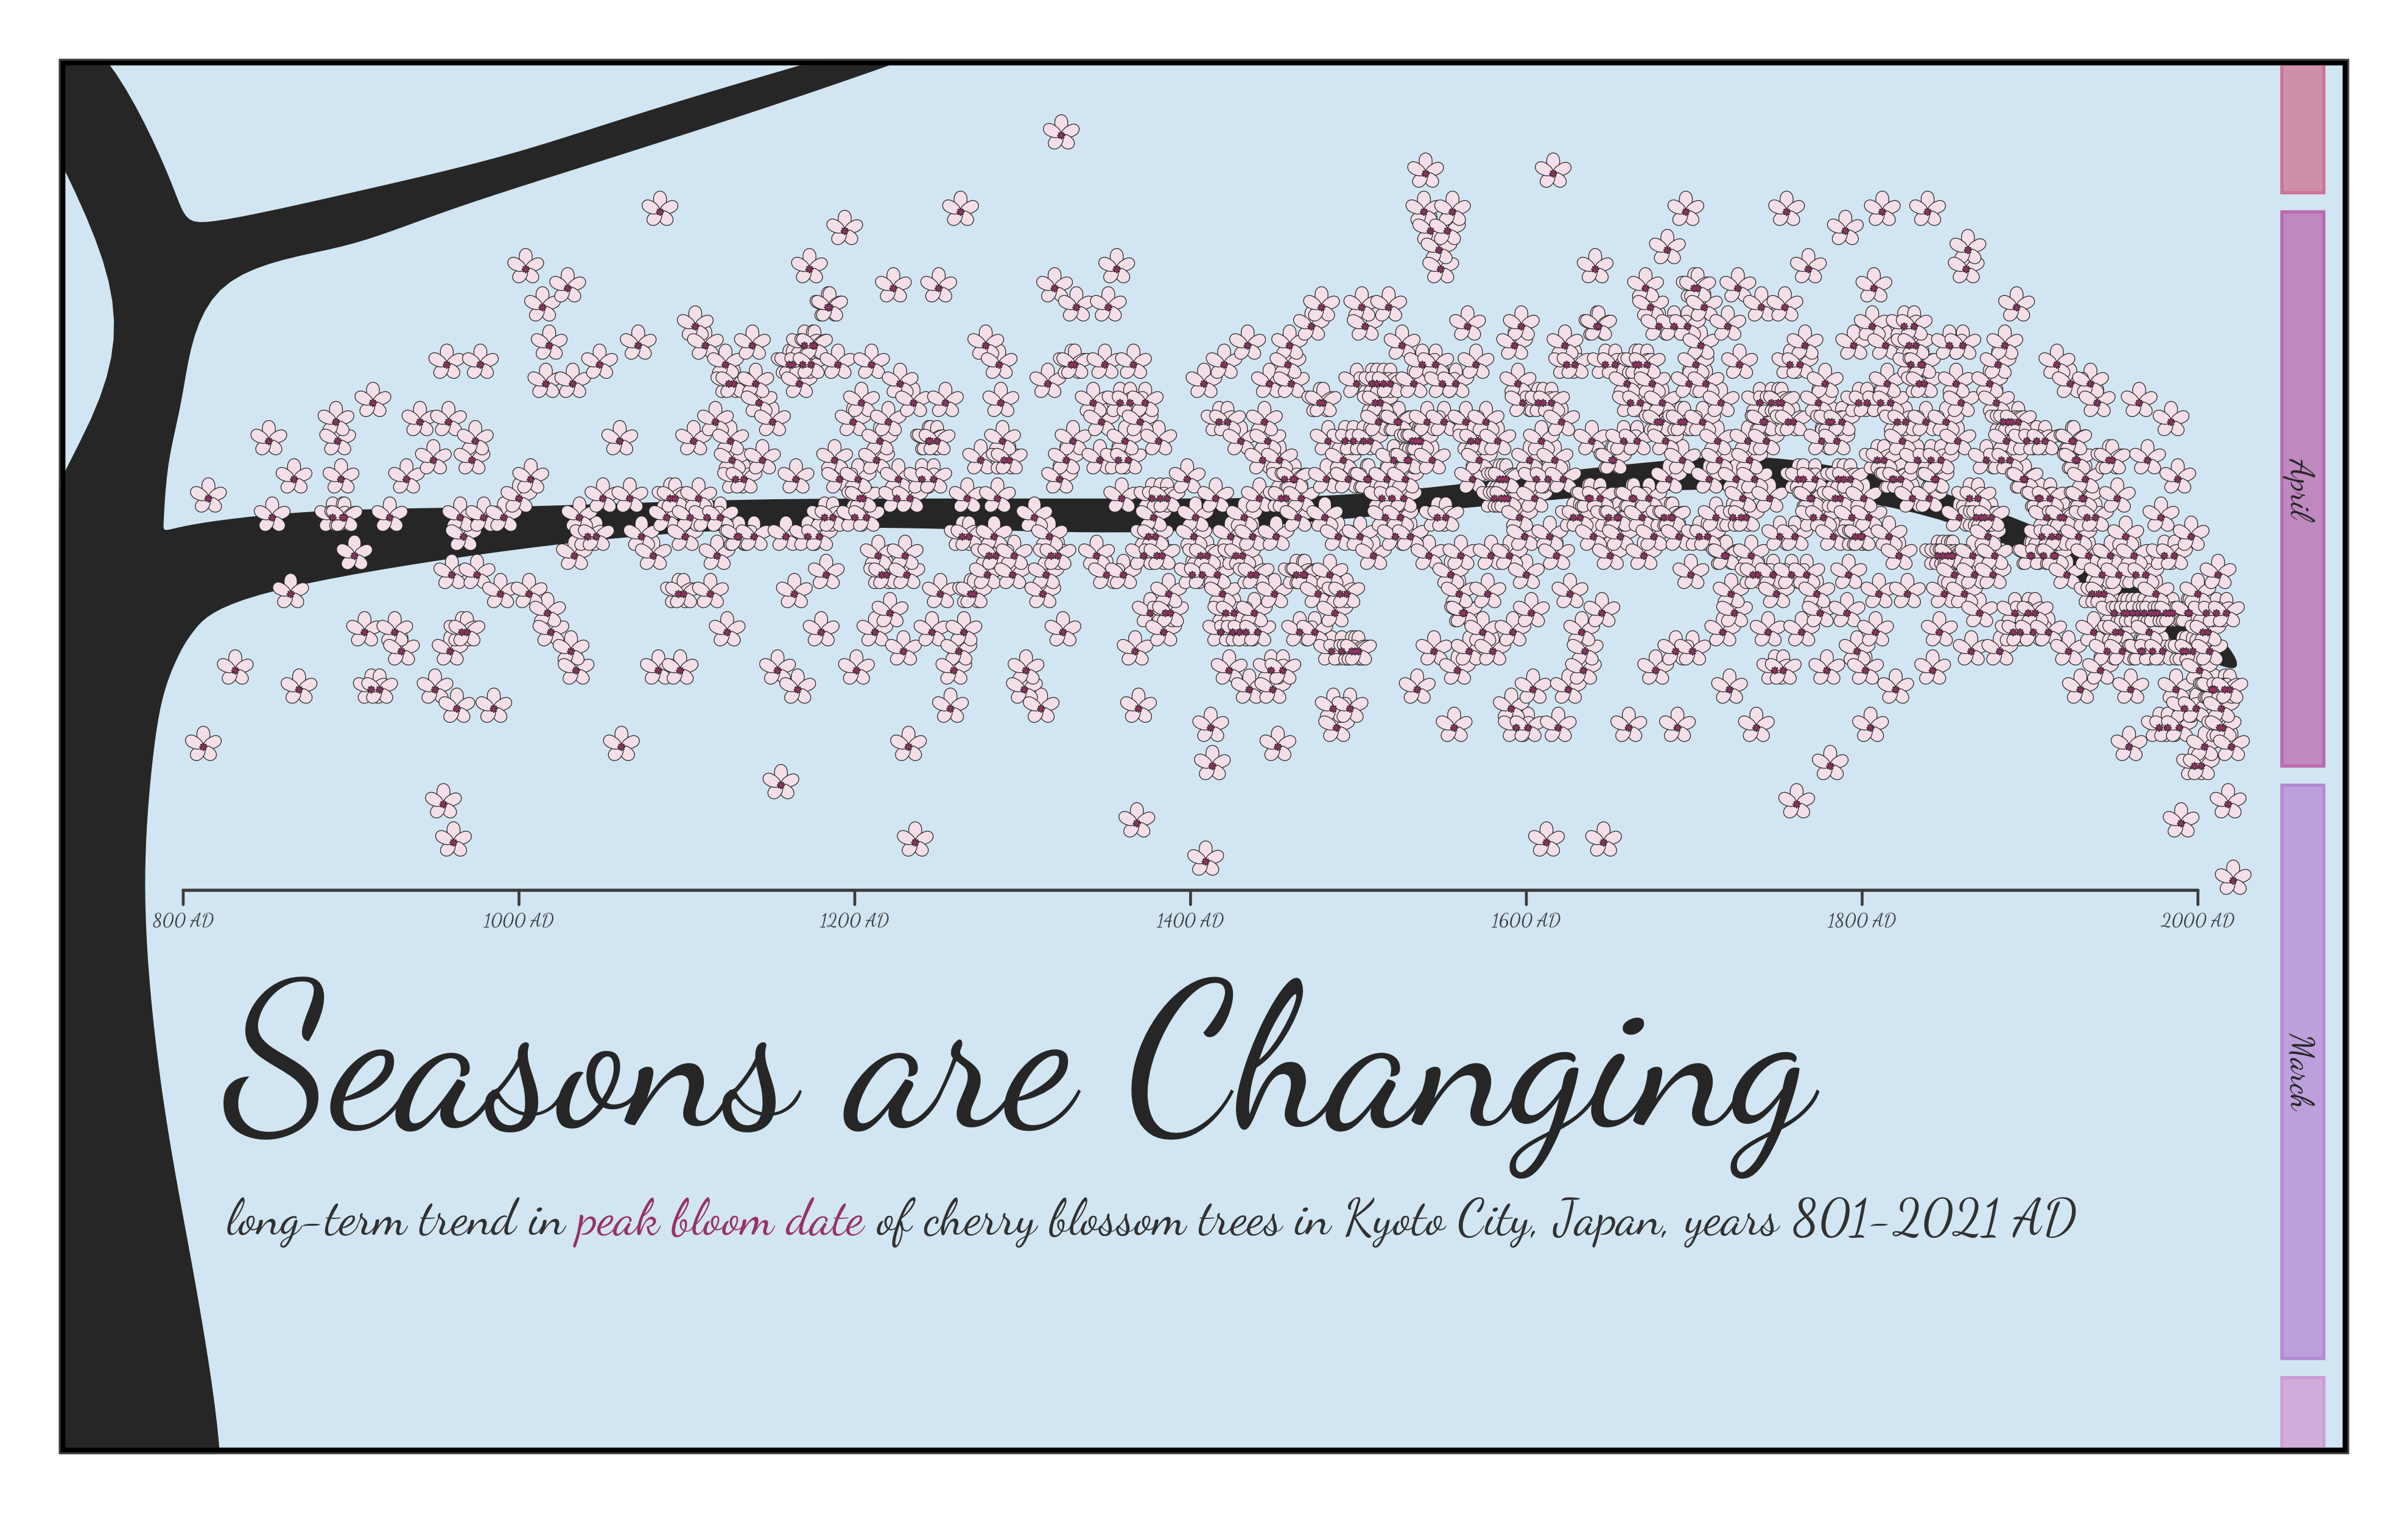
Kyoto Cherry Blossom Blooms
30 Day Chart Challenge Contribution
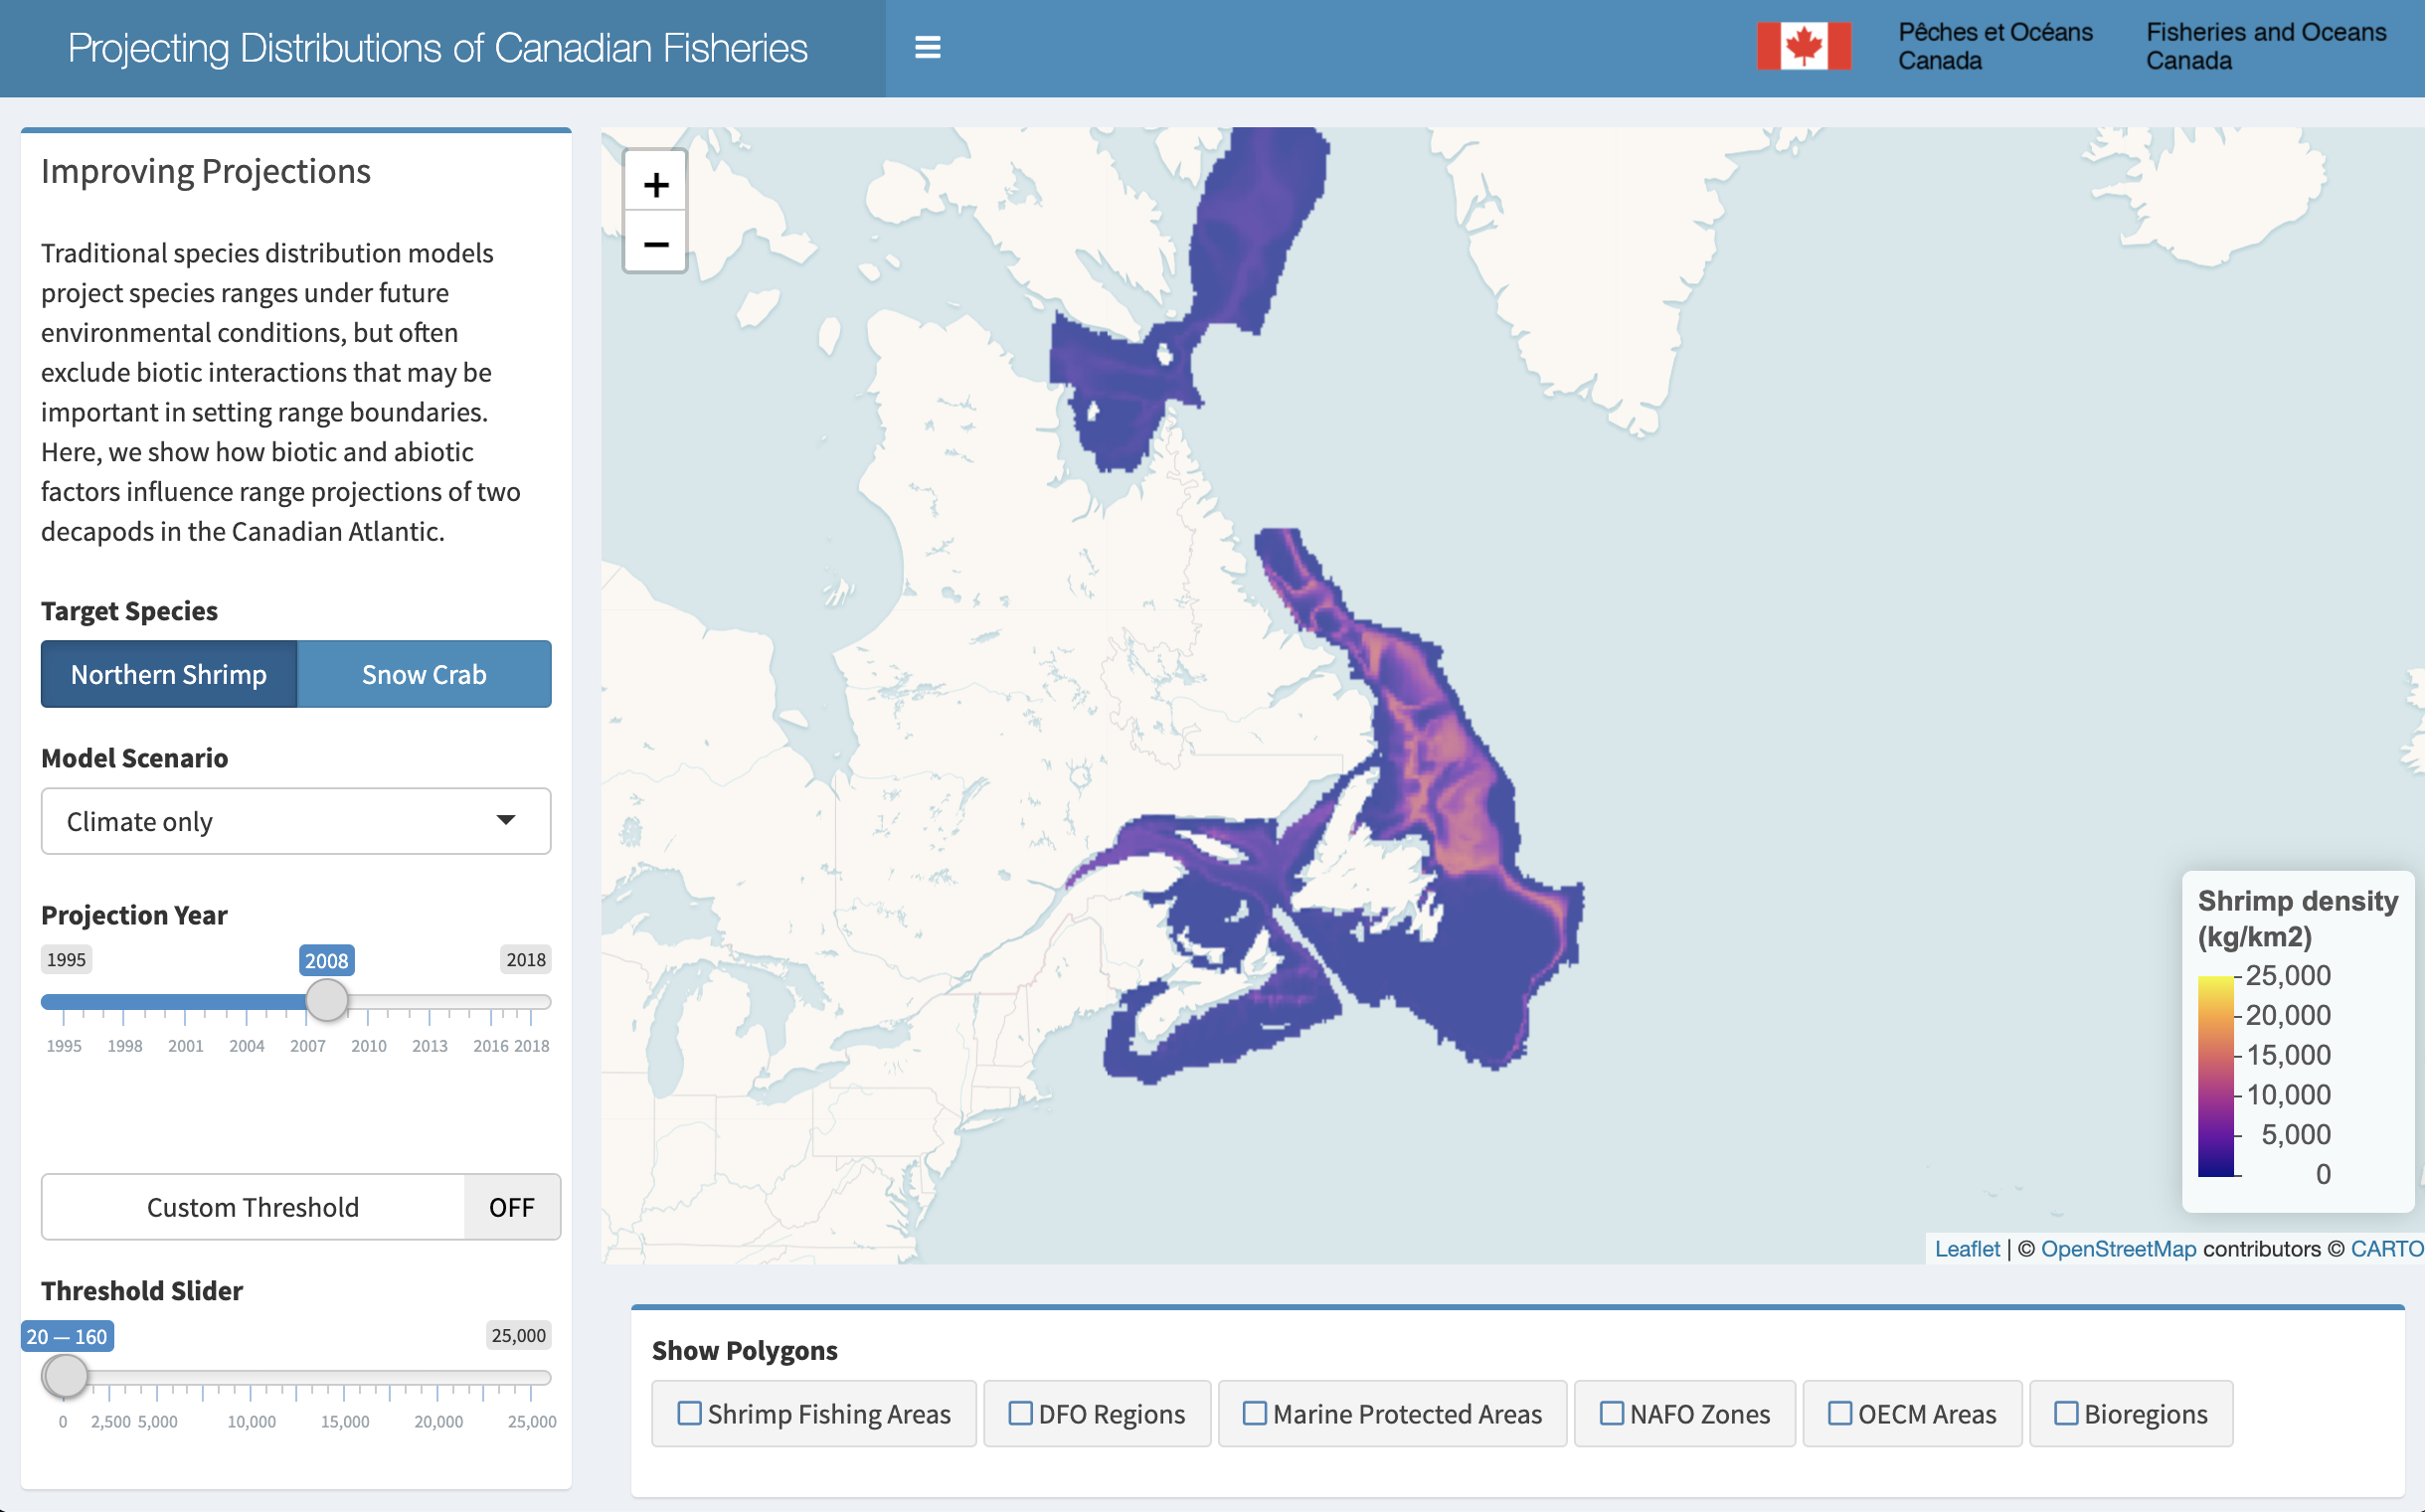
Canadian Fisheries Shiny App
Interactive tool for visualizing model projections of Canadian decapod distributions
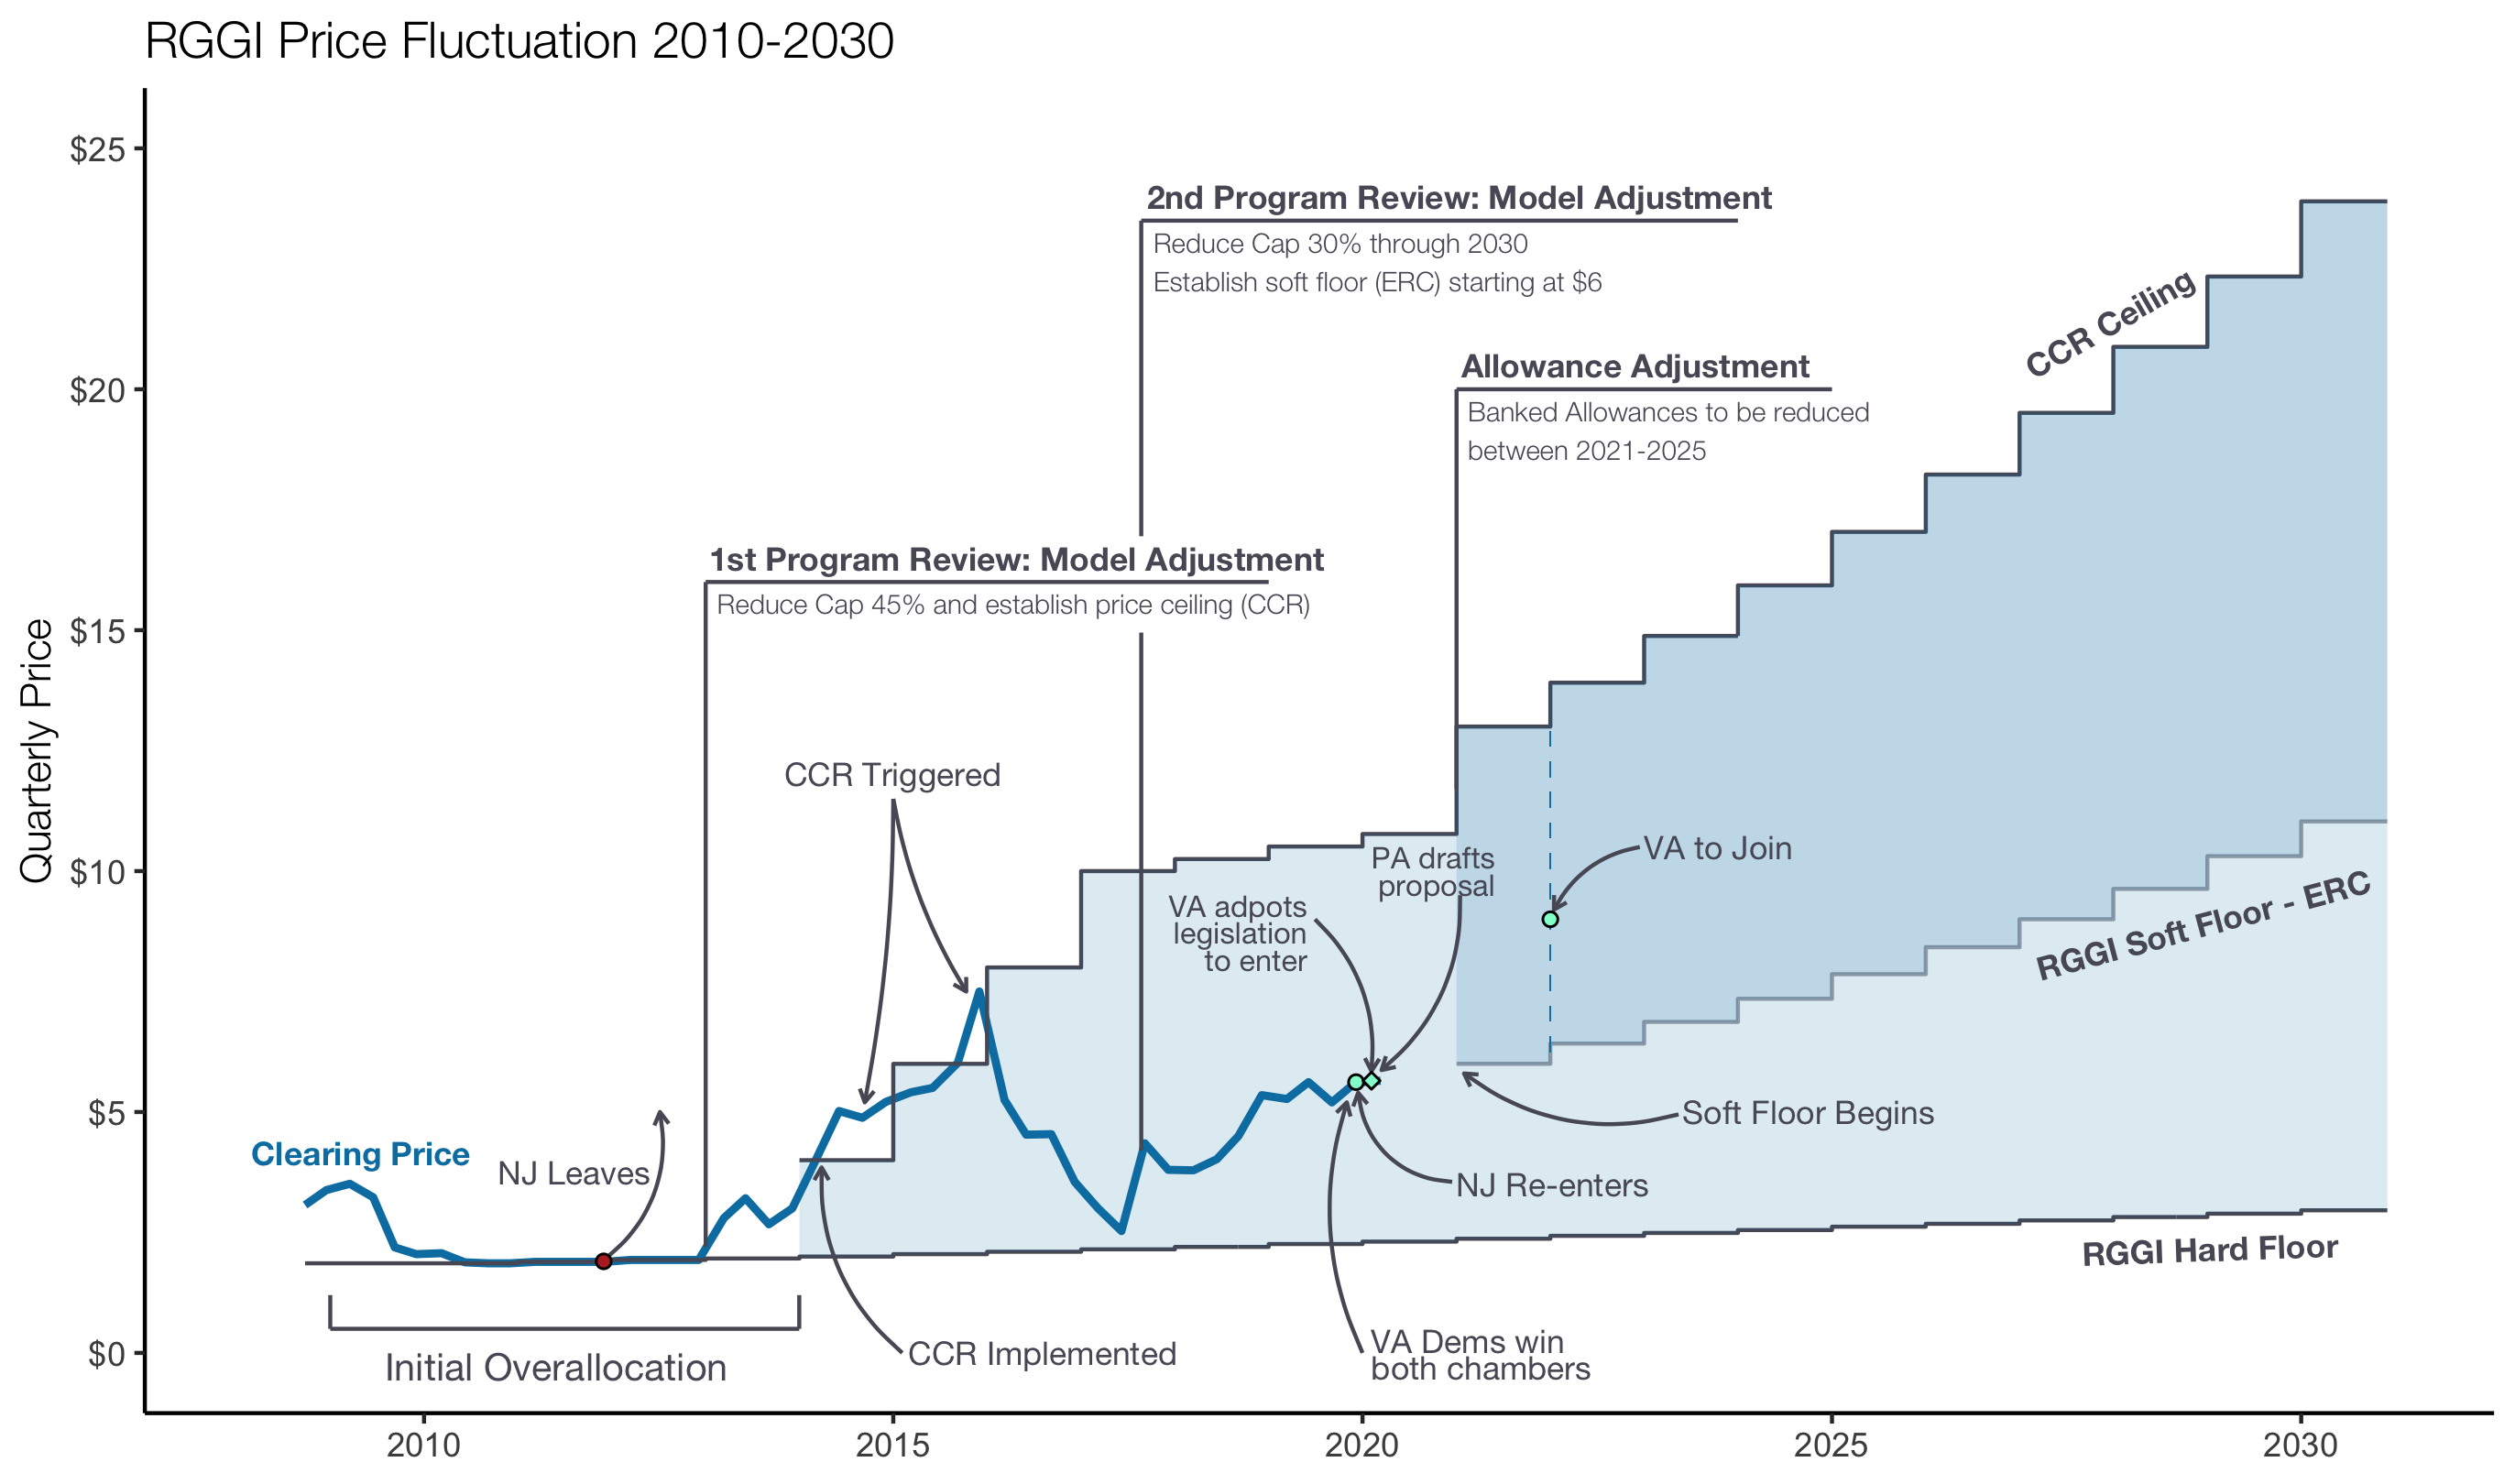
Freelance Data Vis
Various contract projects for visualizing complex data.
Generative Art
My (few) contributions to "Generative Art January"
PNWColors
R Package for color palettes inspired by the Pacific Northwest
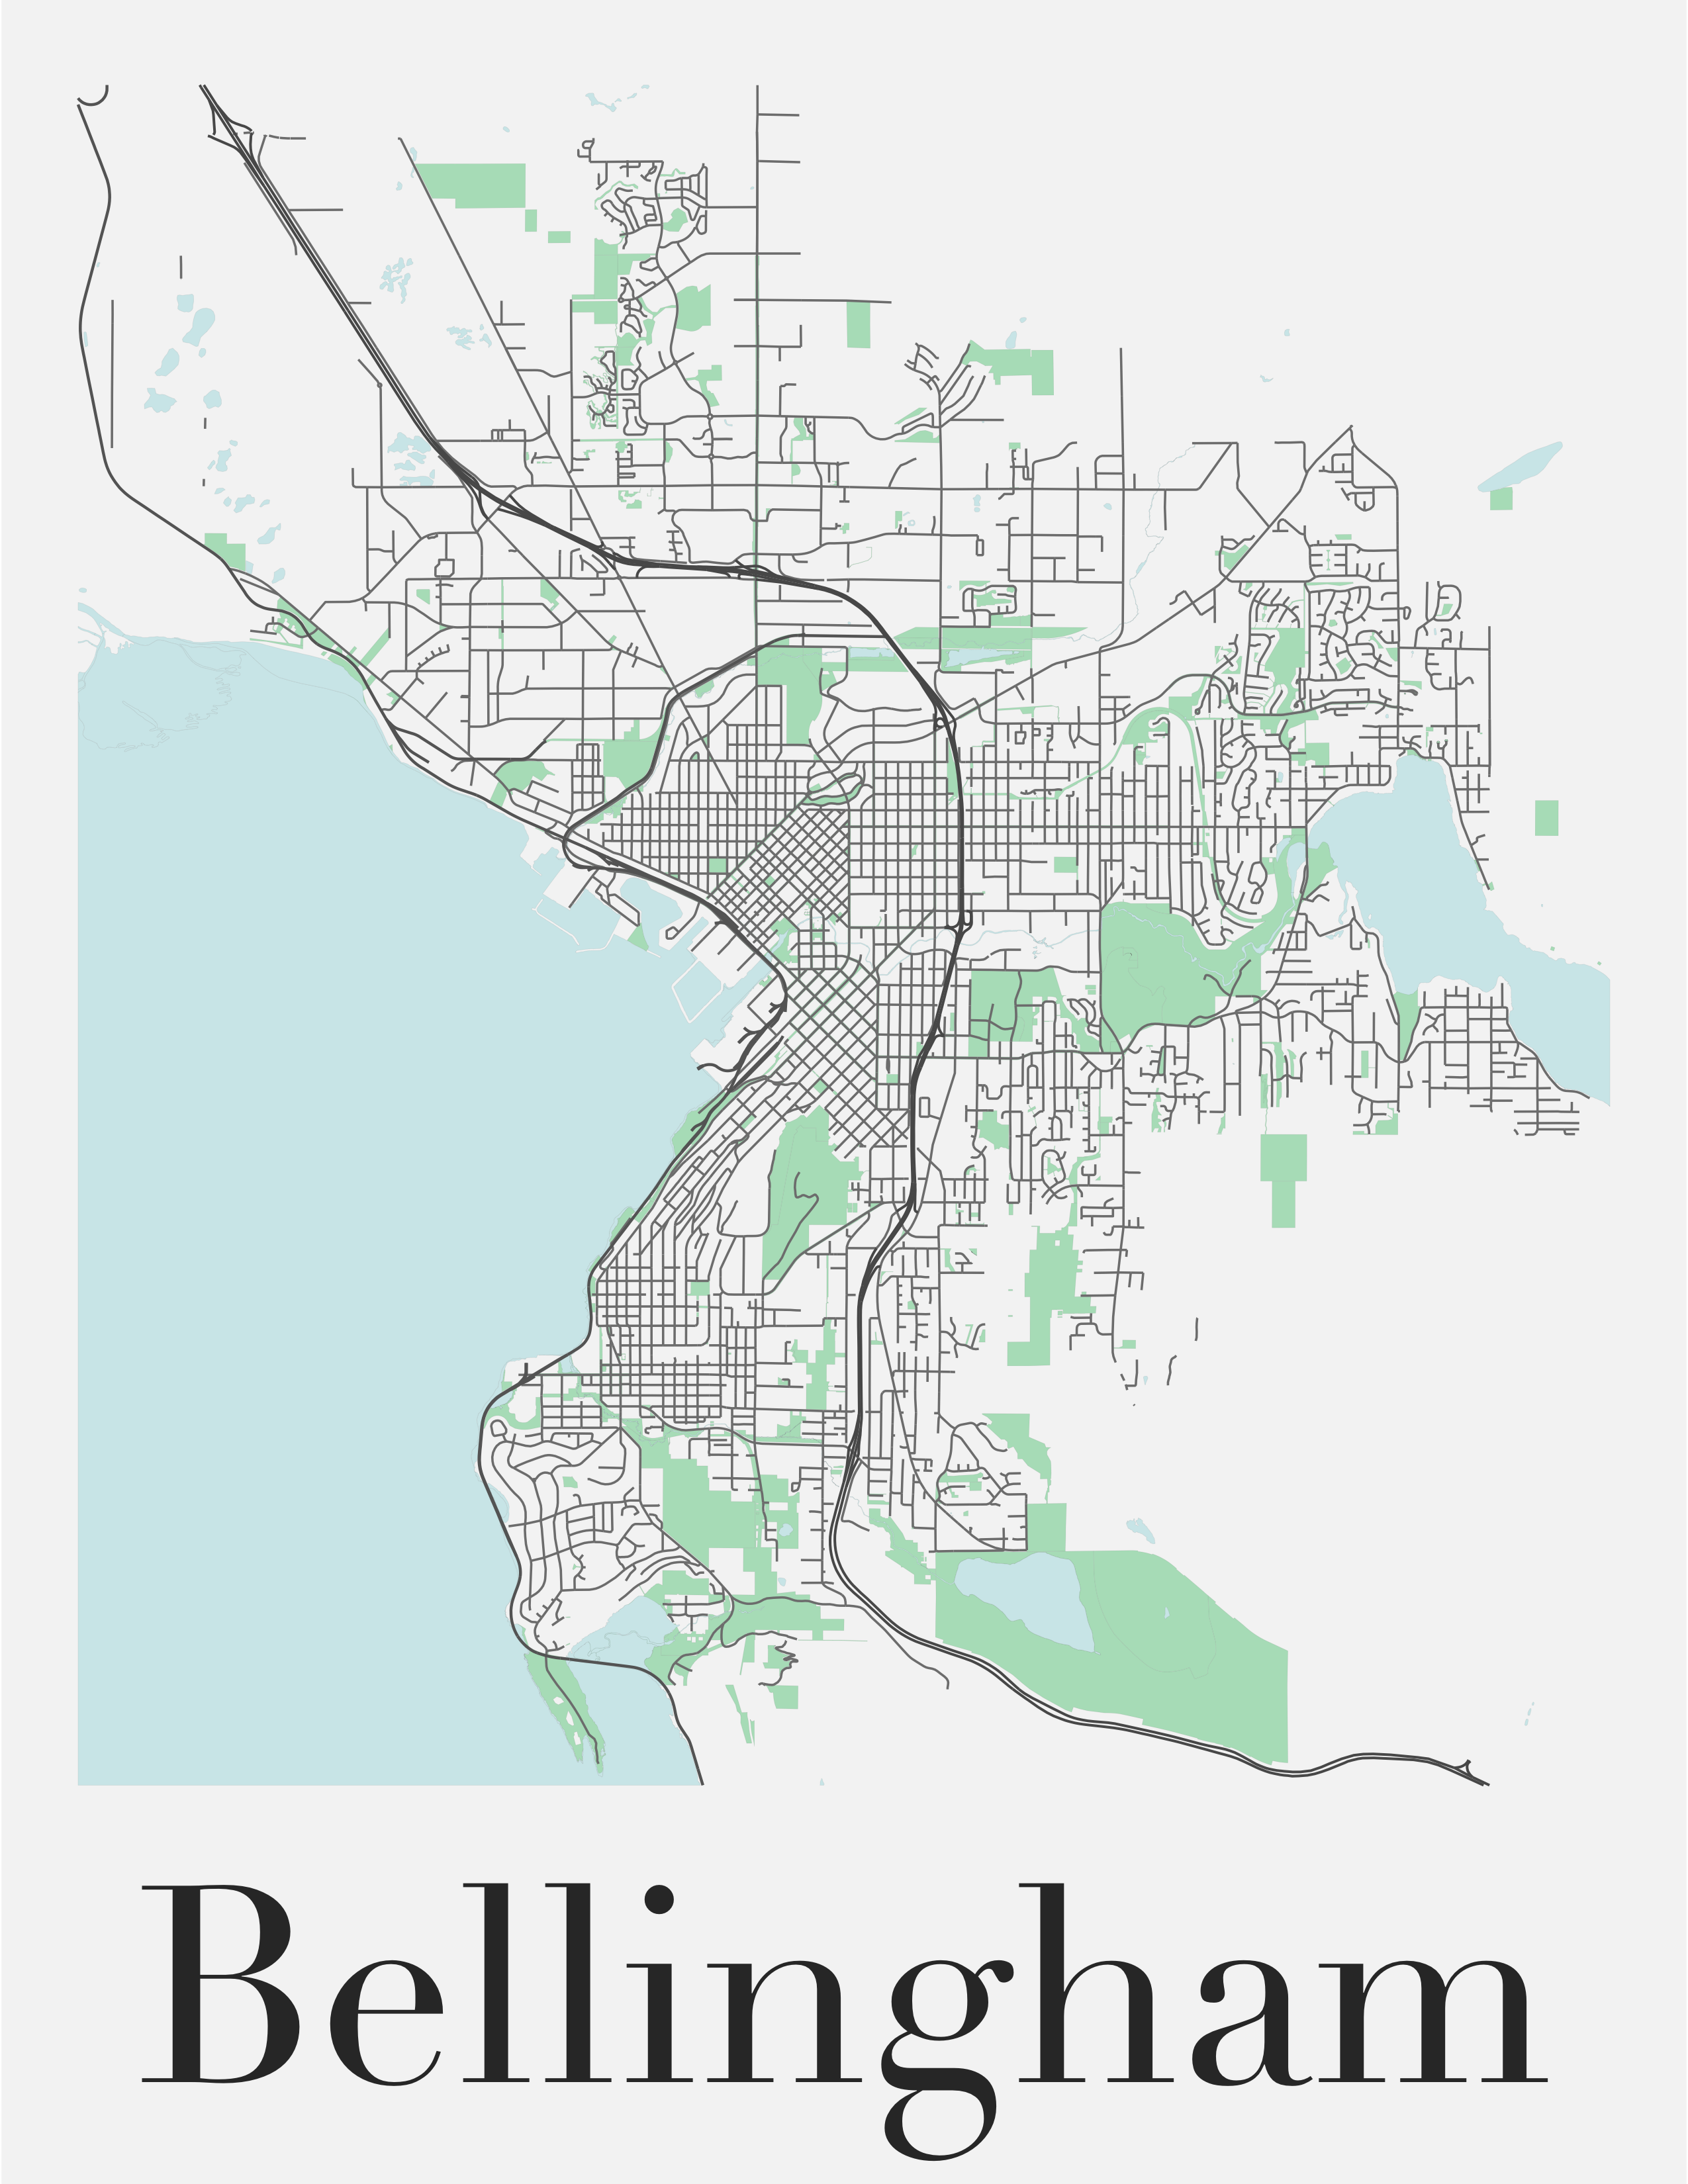
Bellingham Map Poster
Bellingham public city data map poster