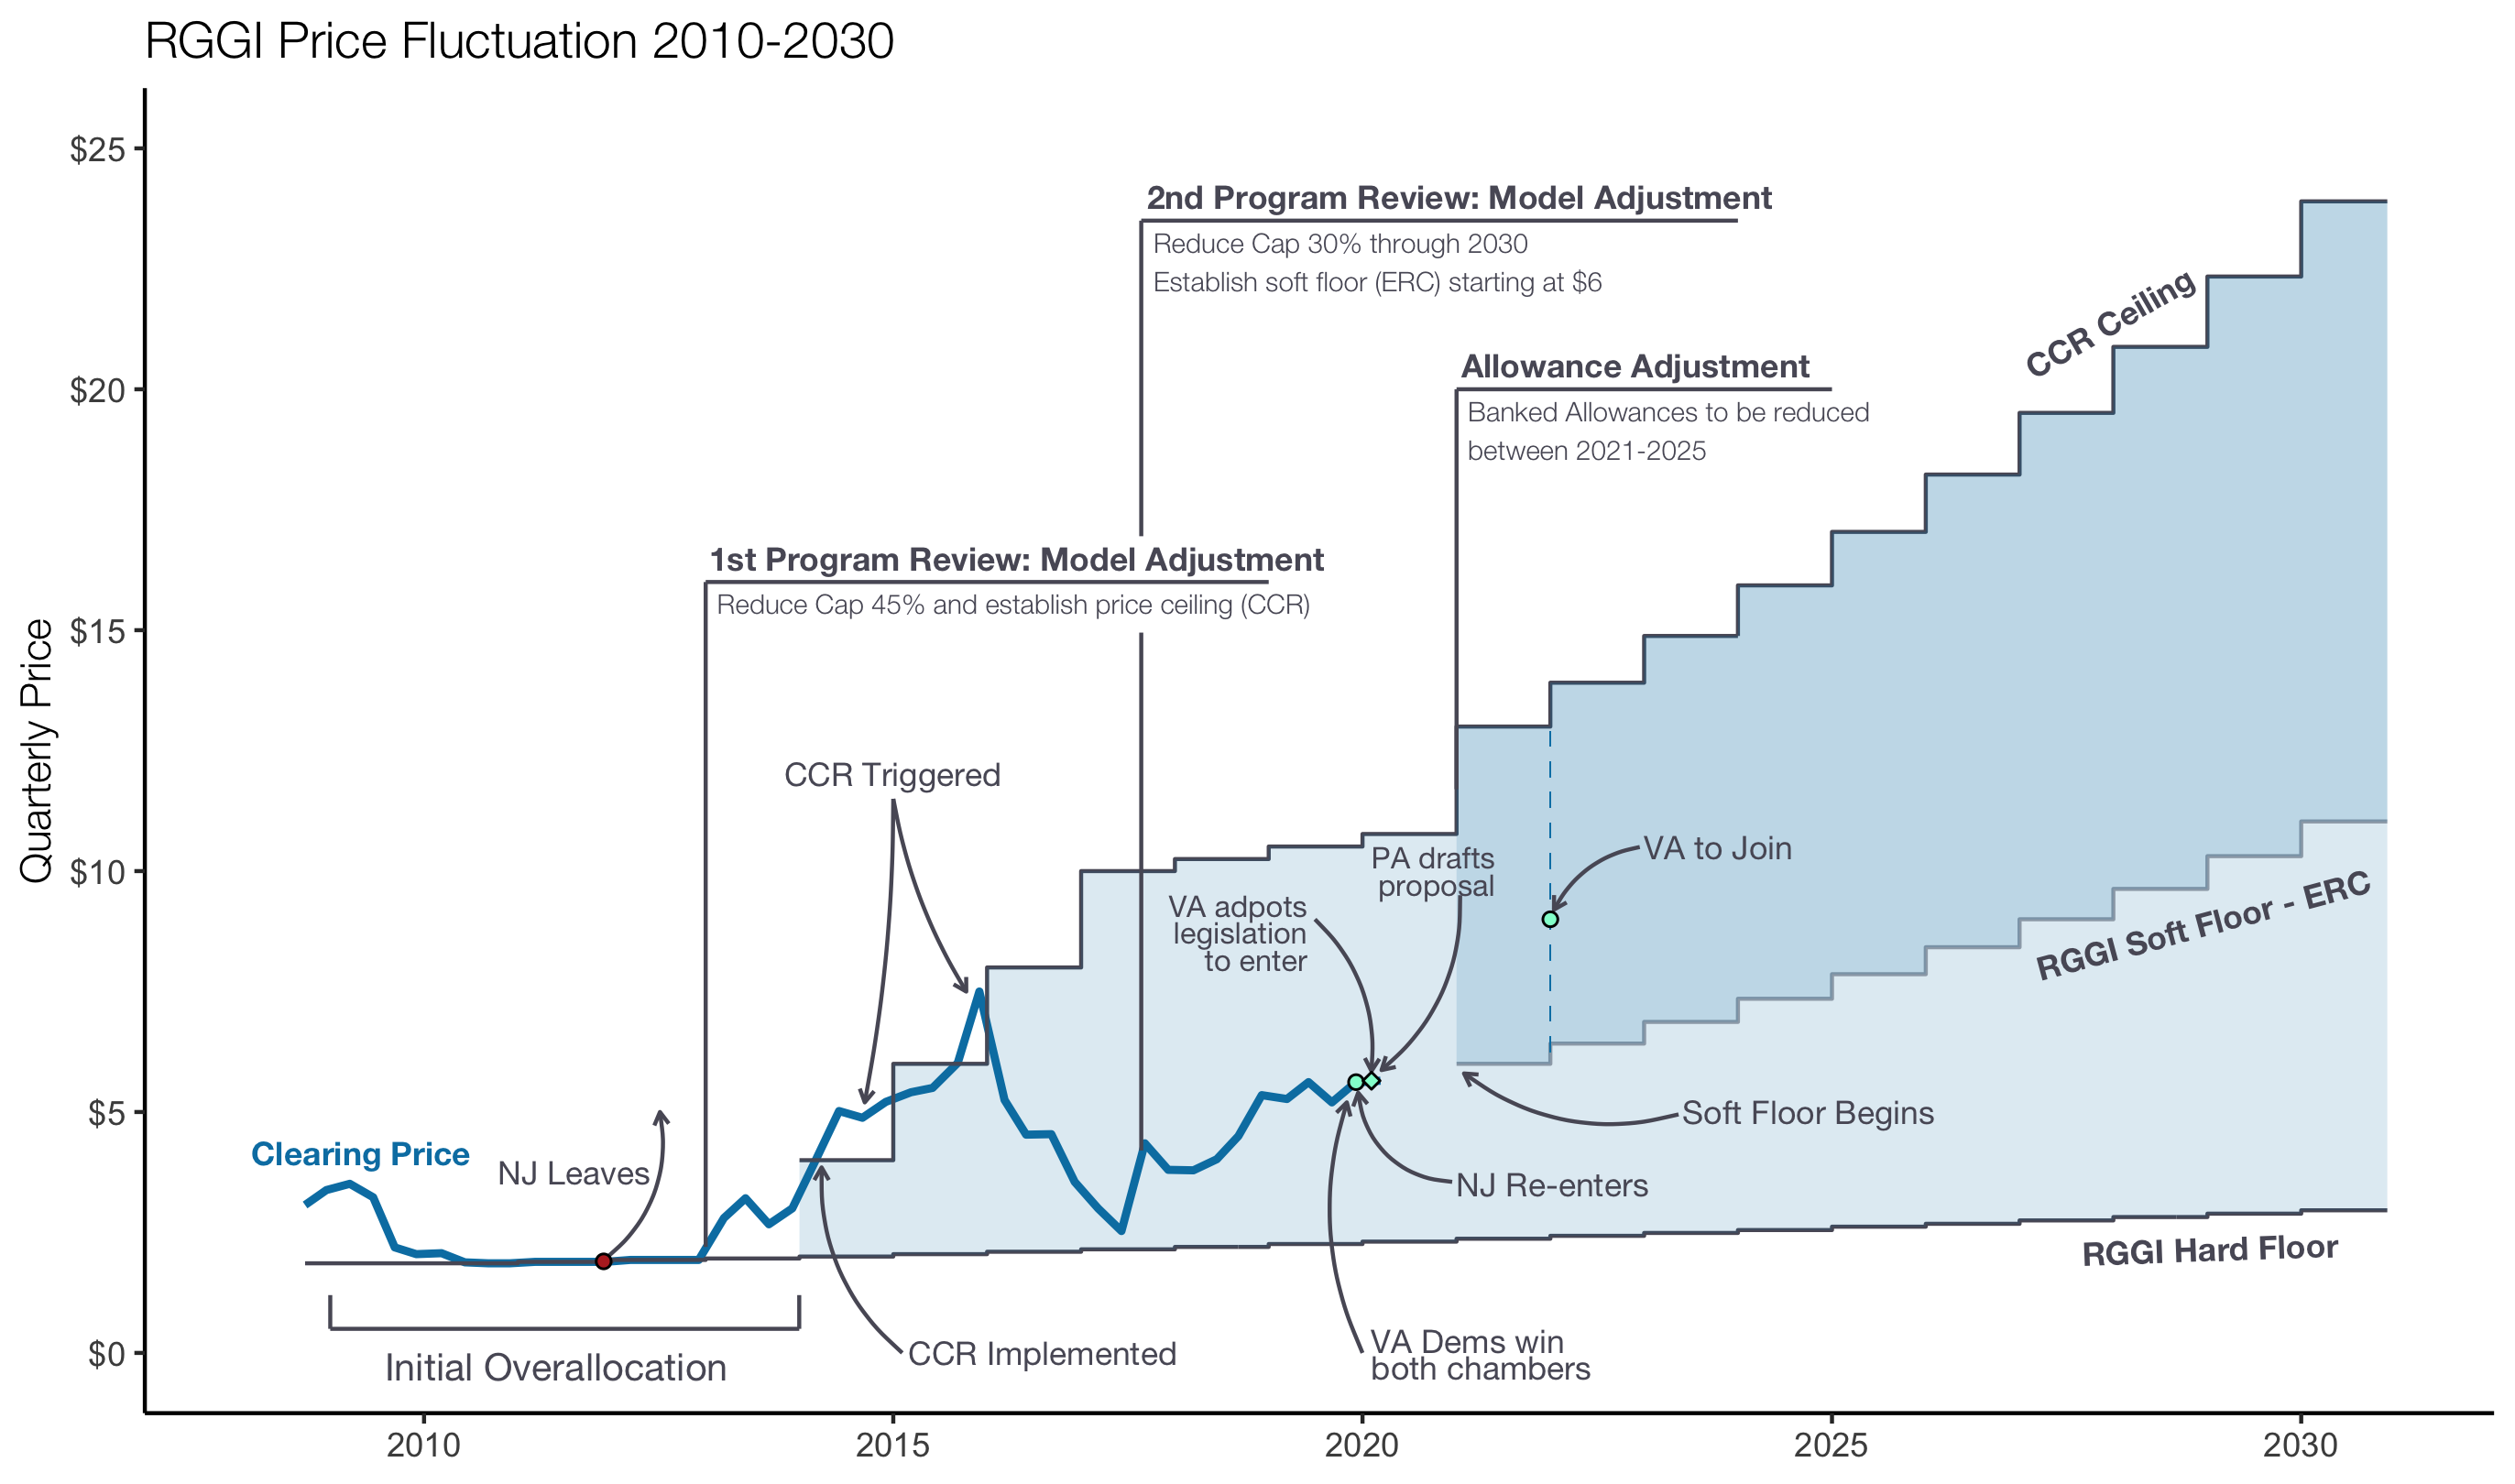
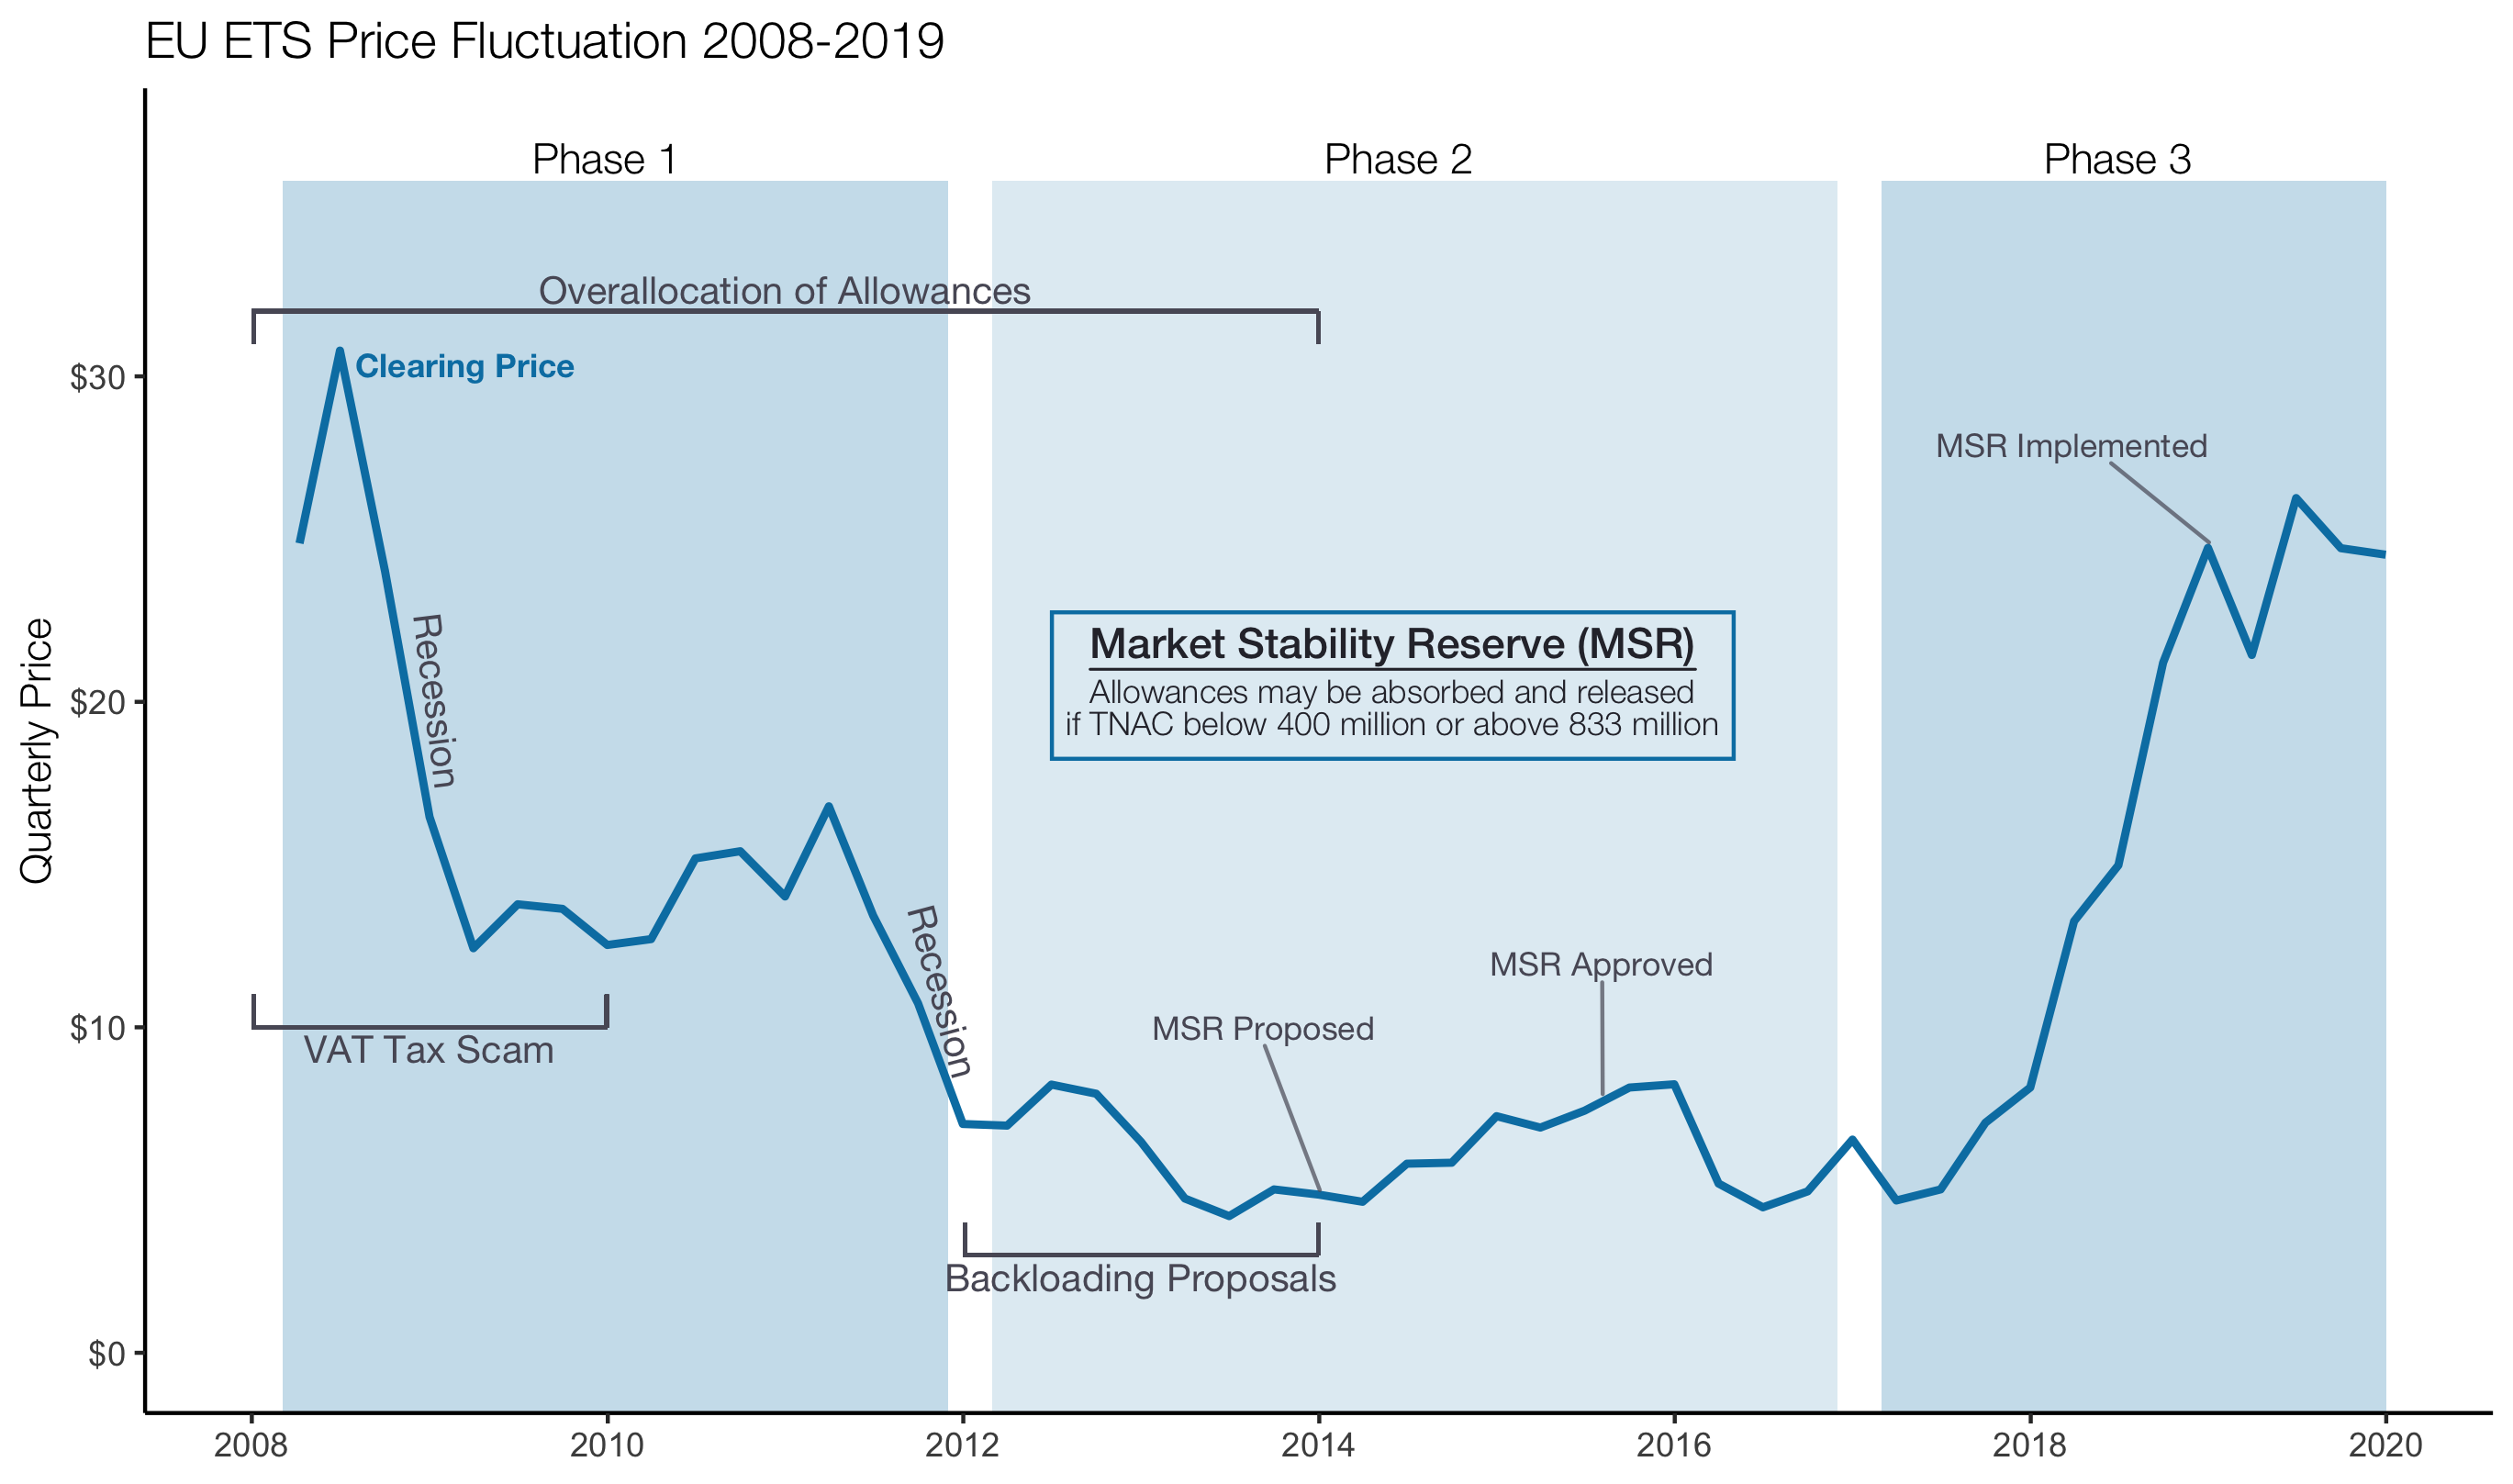
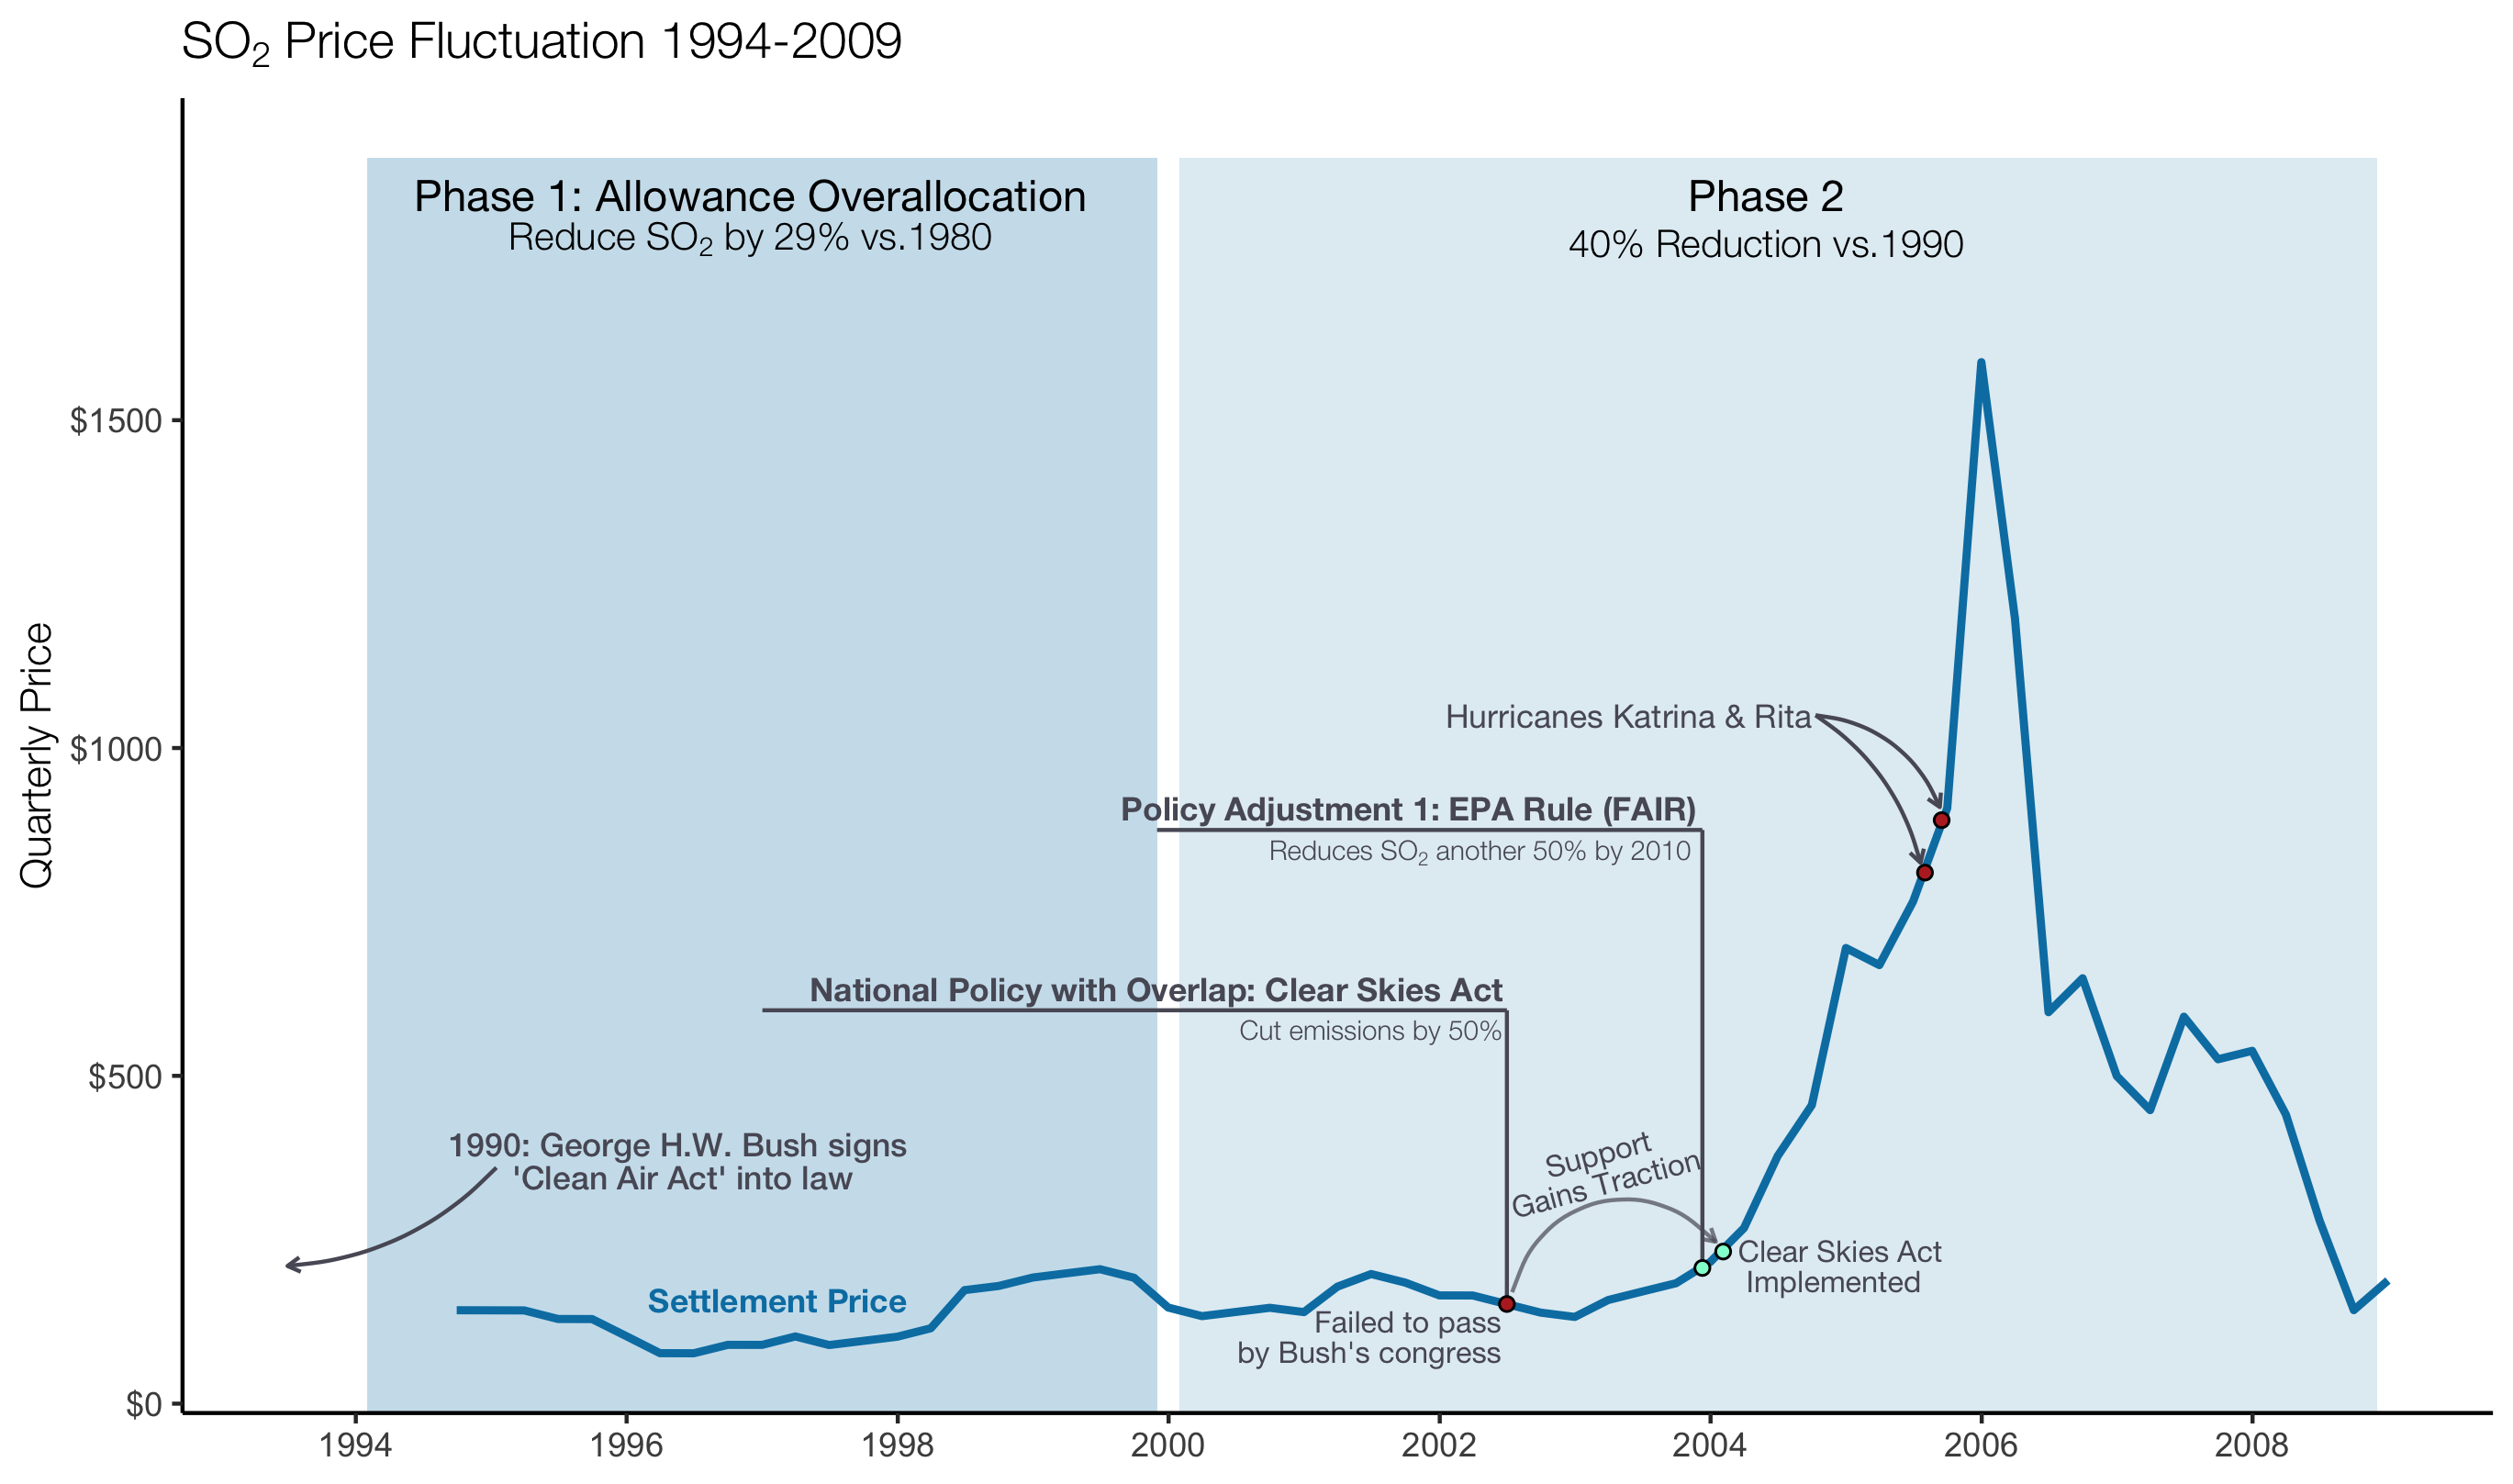
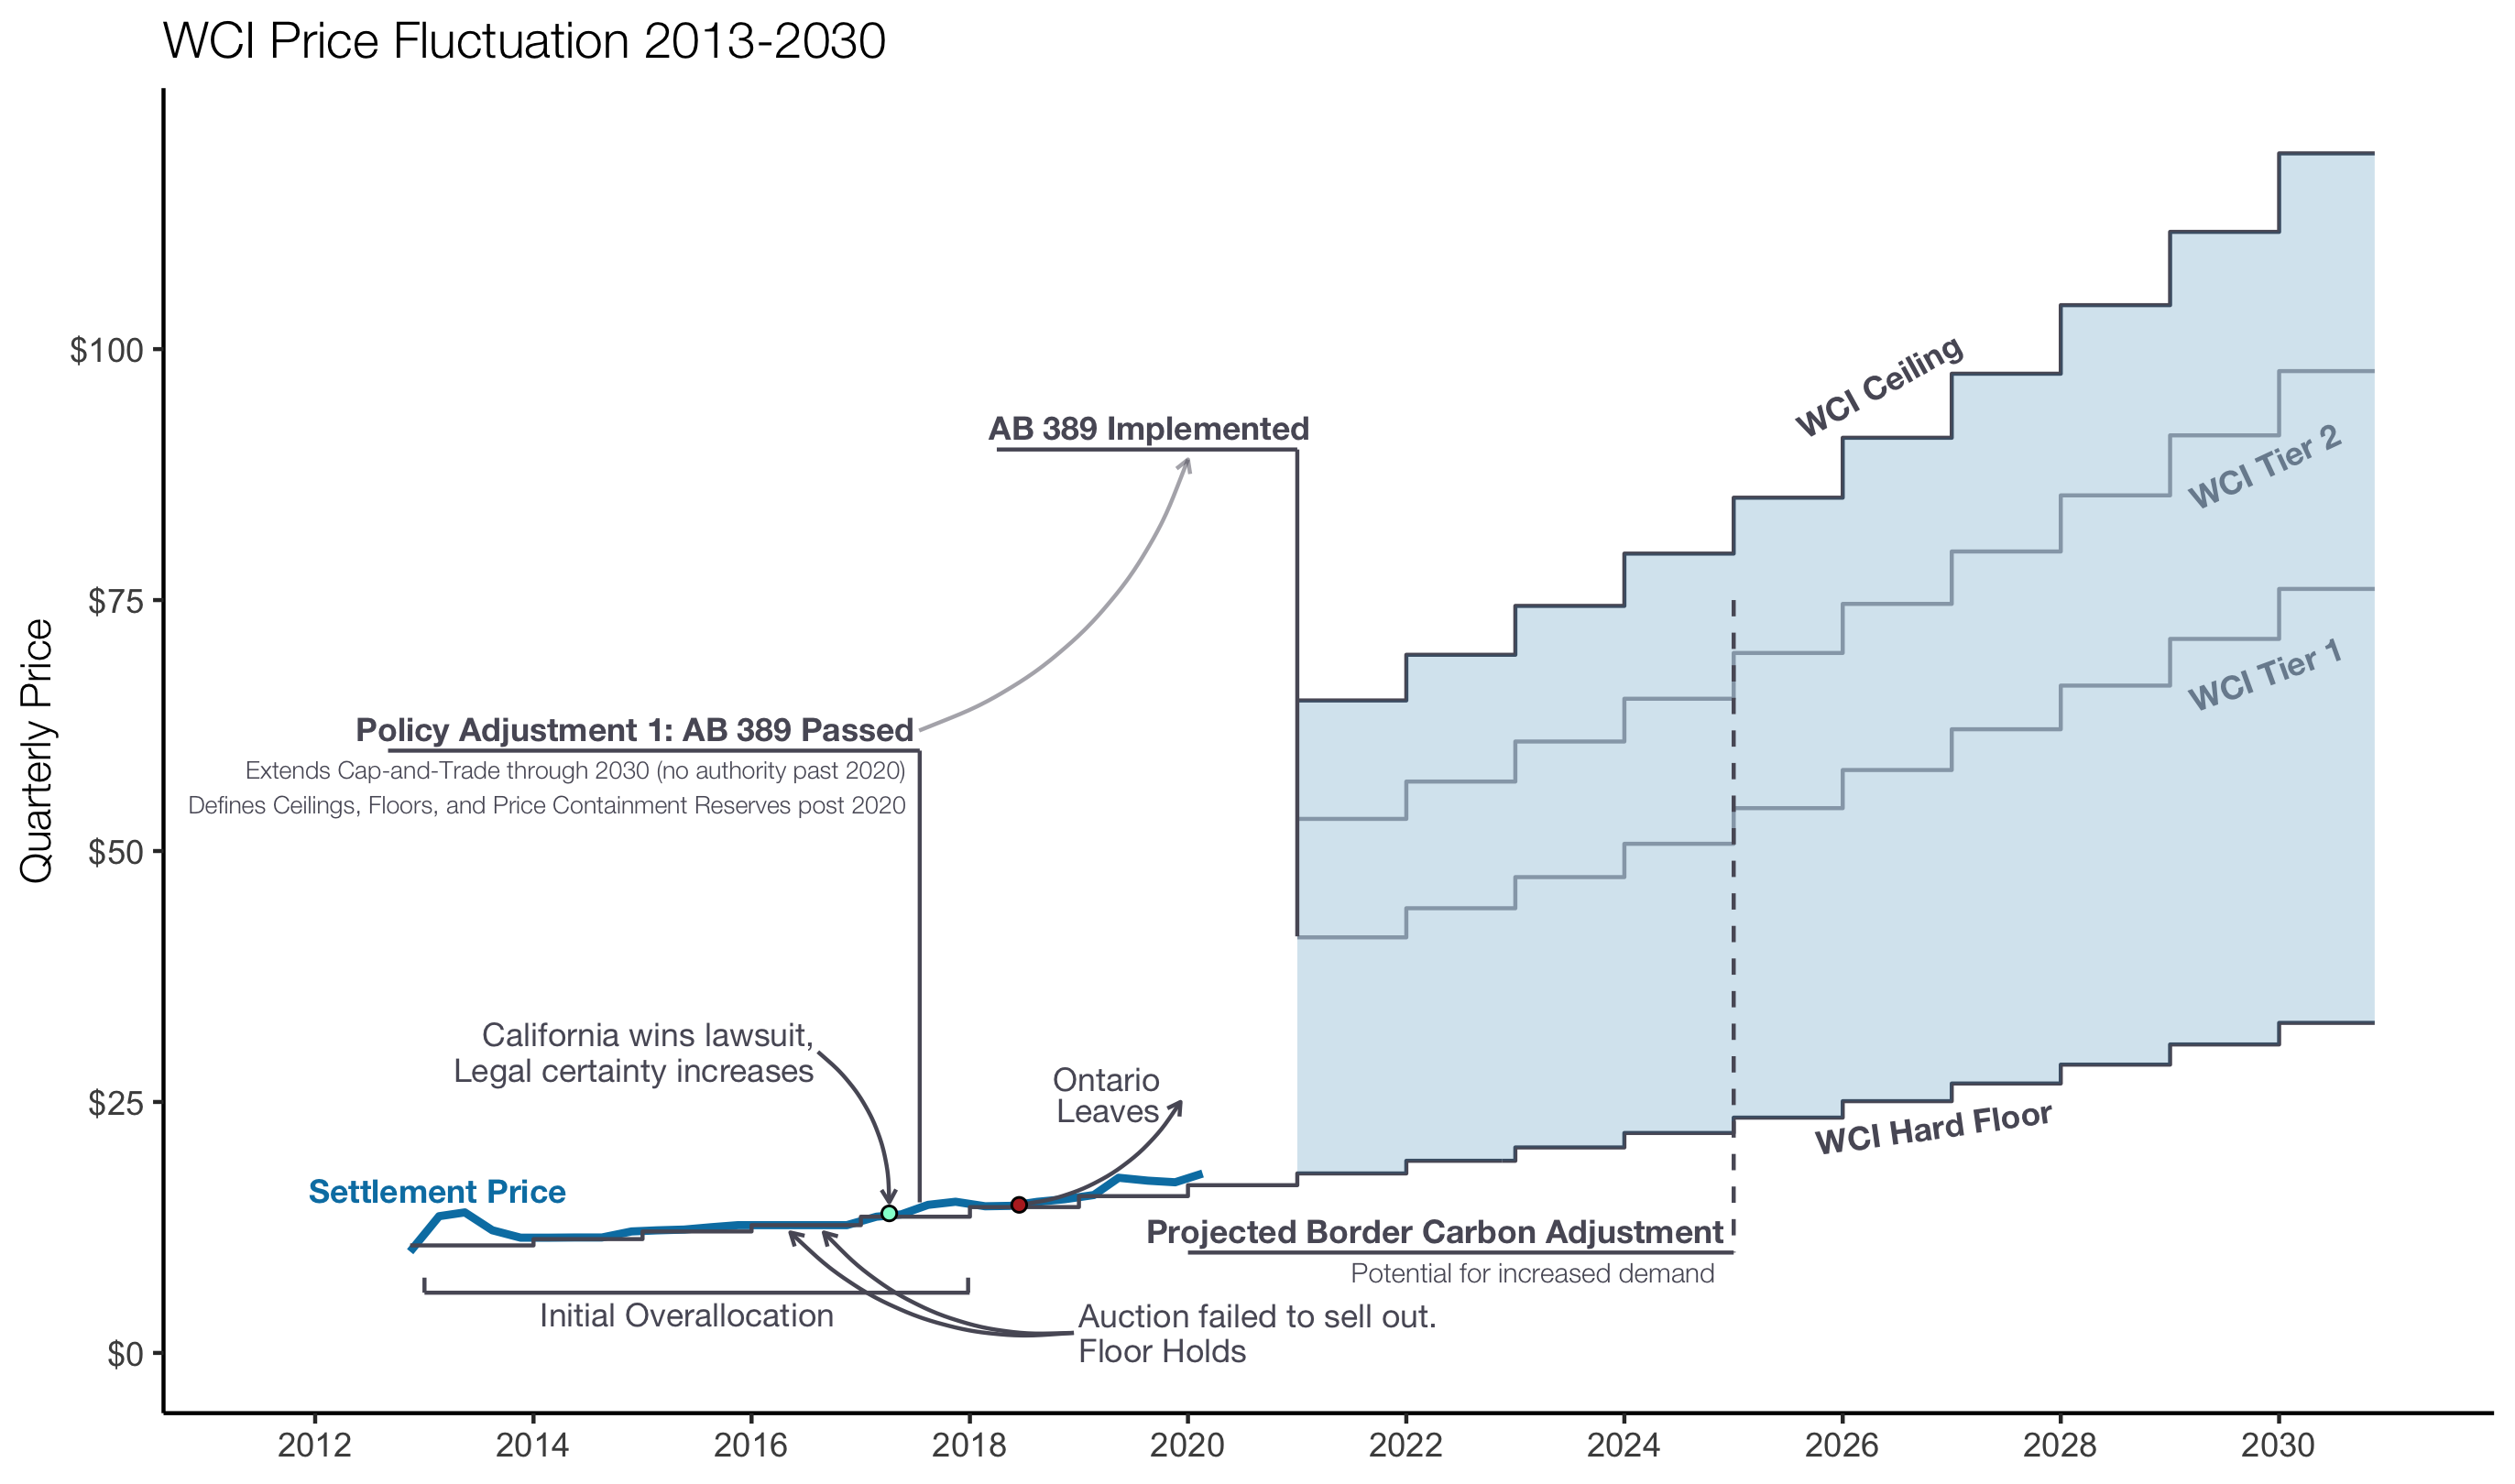
Policy-Driven Market Fluctuations
This is a series of plots I made for a California carbon tax consultancy showing market prices of fossil fuel emissions from specific policy initiatives around the world. The specific events and acronyms denoted in these graphs are somewhat esoteric and were largely chosen by the client, but I focused on using clear annotations, color, and spacing to effectively communicate the client’s ideas. All plots were completed using ggplot2 and ggforce.