Freelance Data Vis
During the pandemic, I completed a number of data visualization contract projects to apply my skills in various fields and practice project management and client relations. Below are a few examples of how I have applied my skills outside of my normal field of ecology.
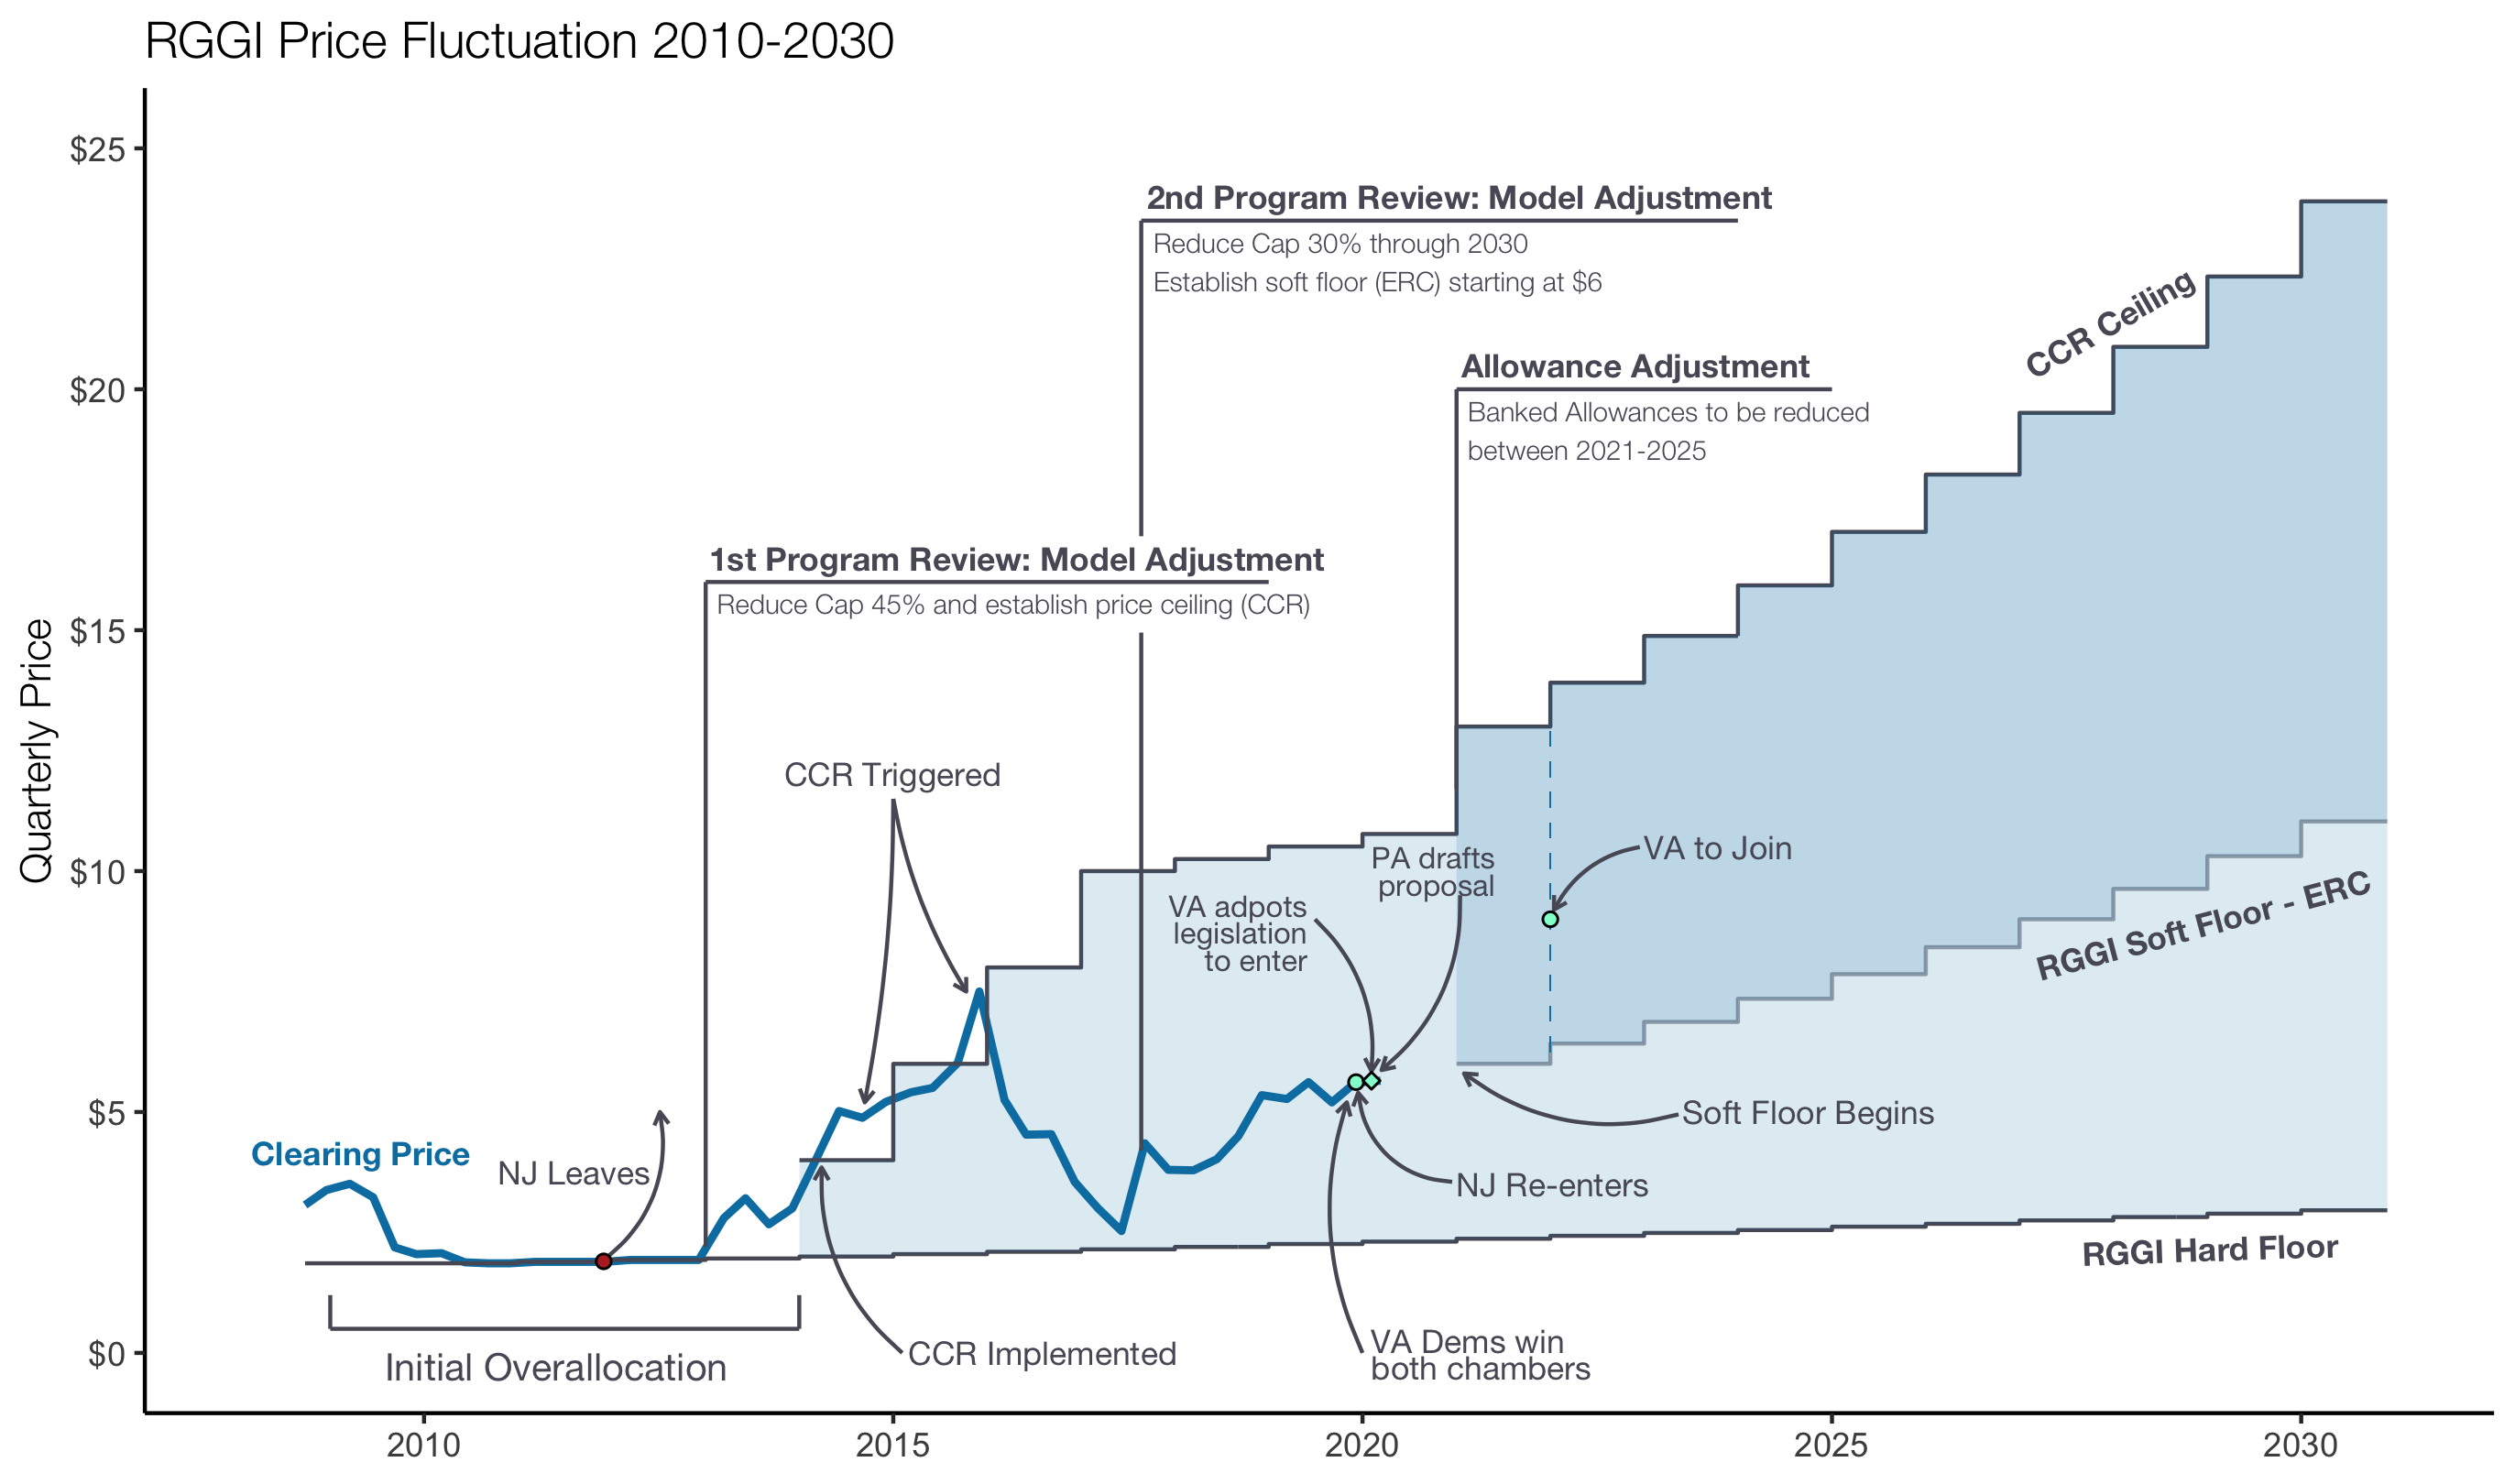
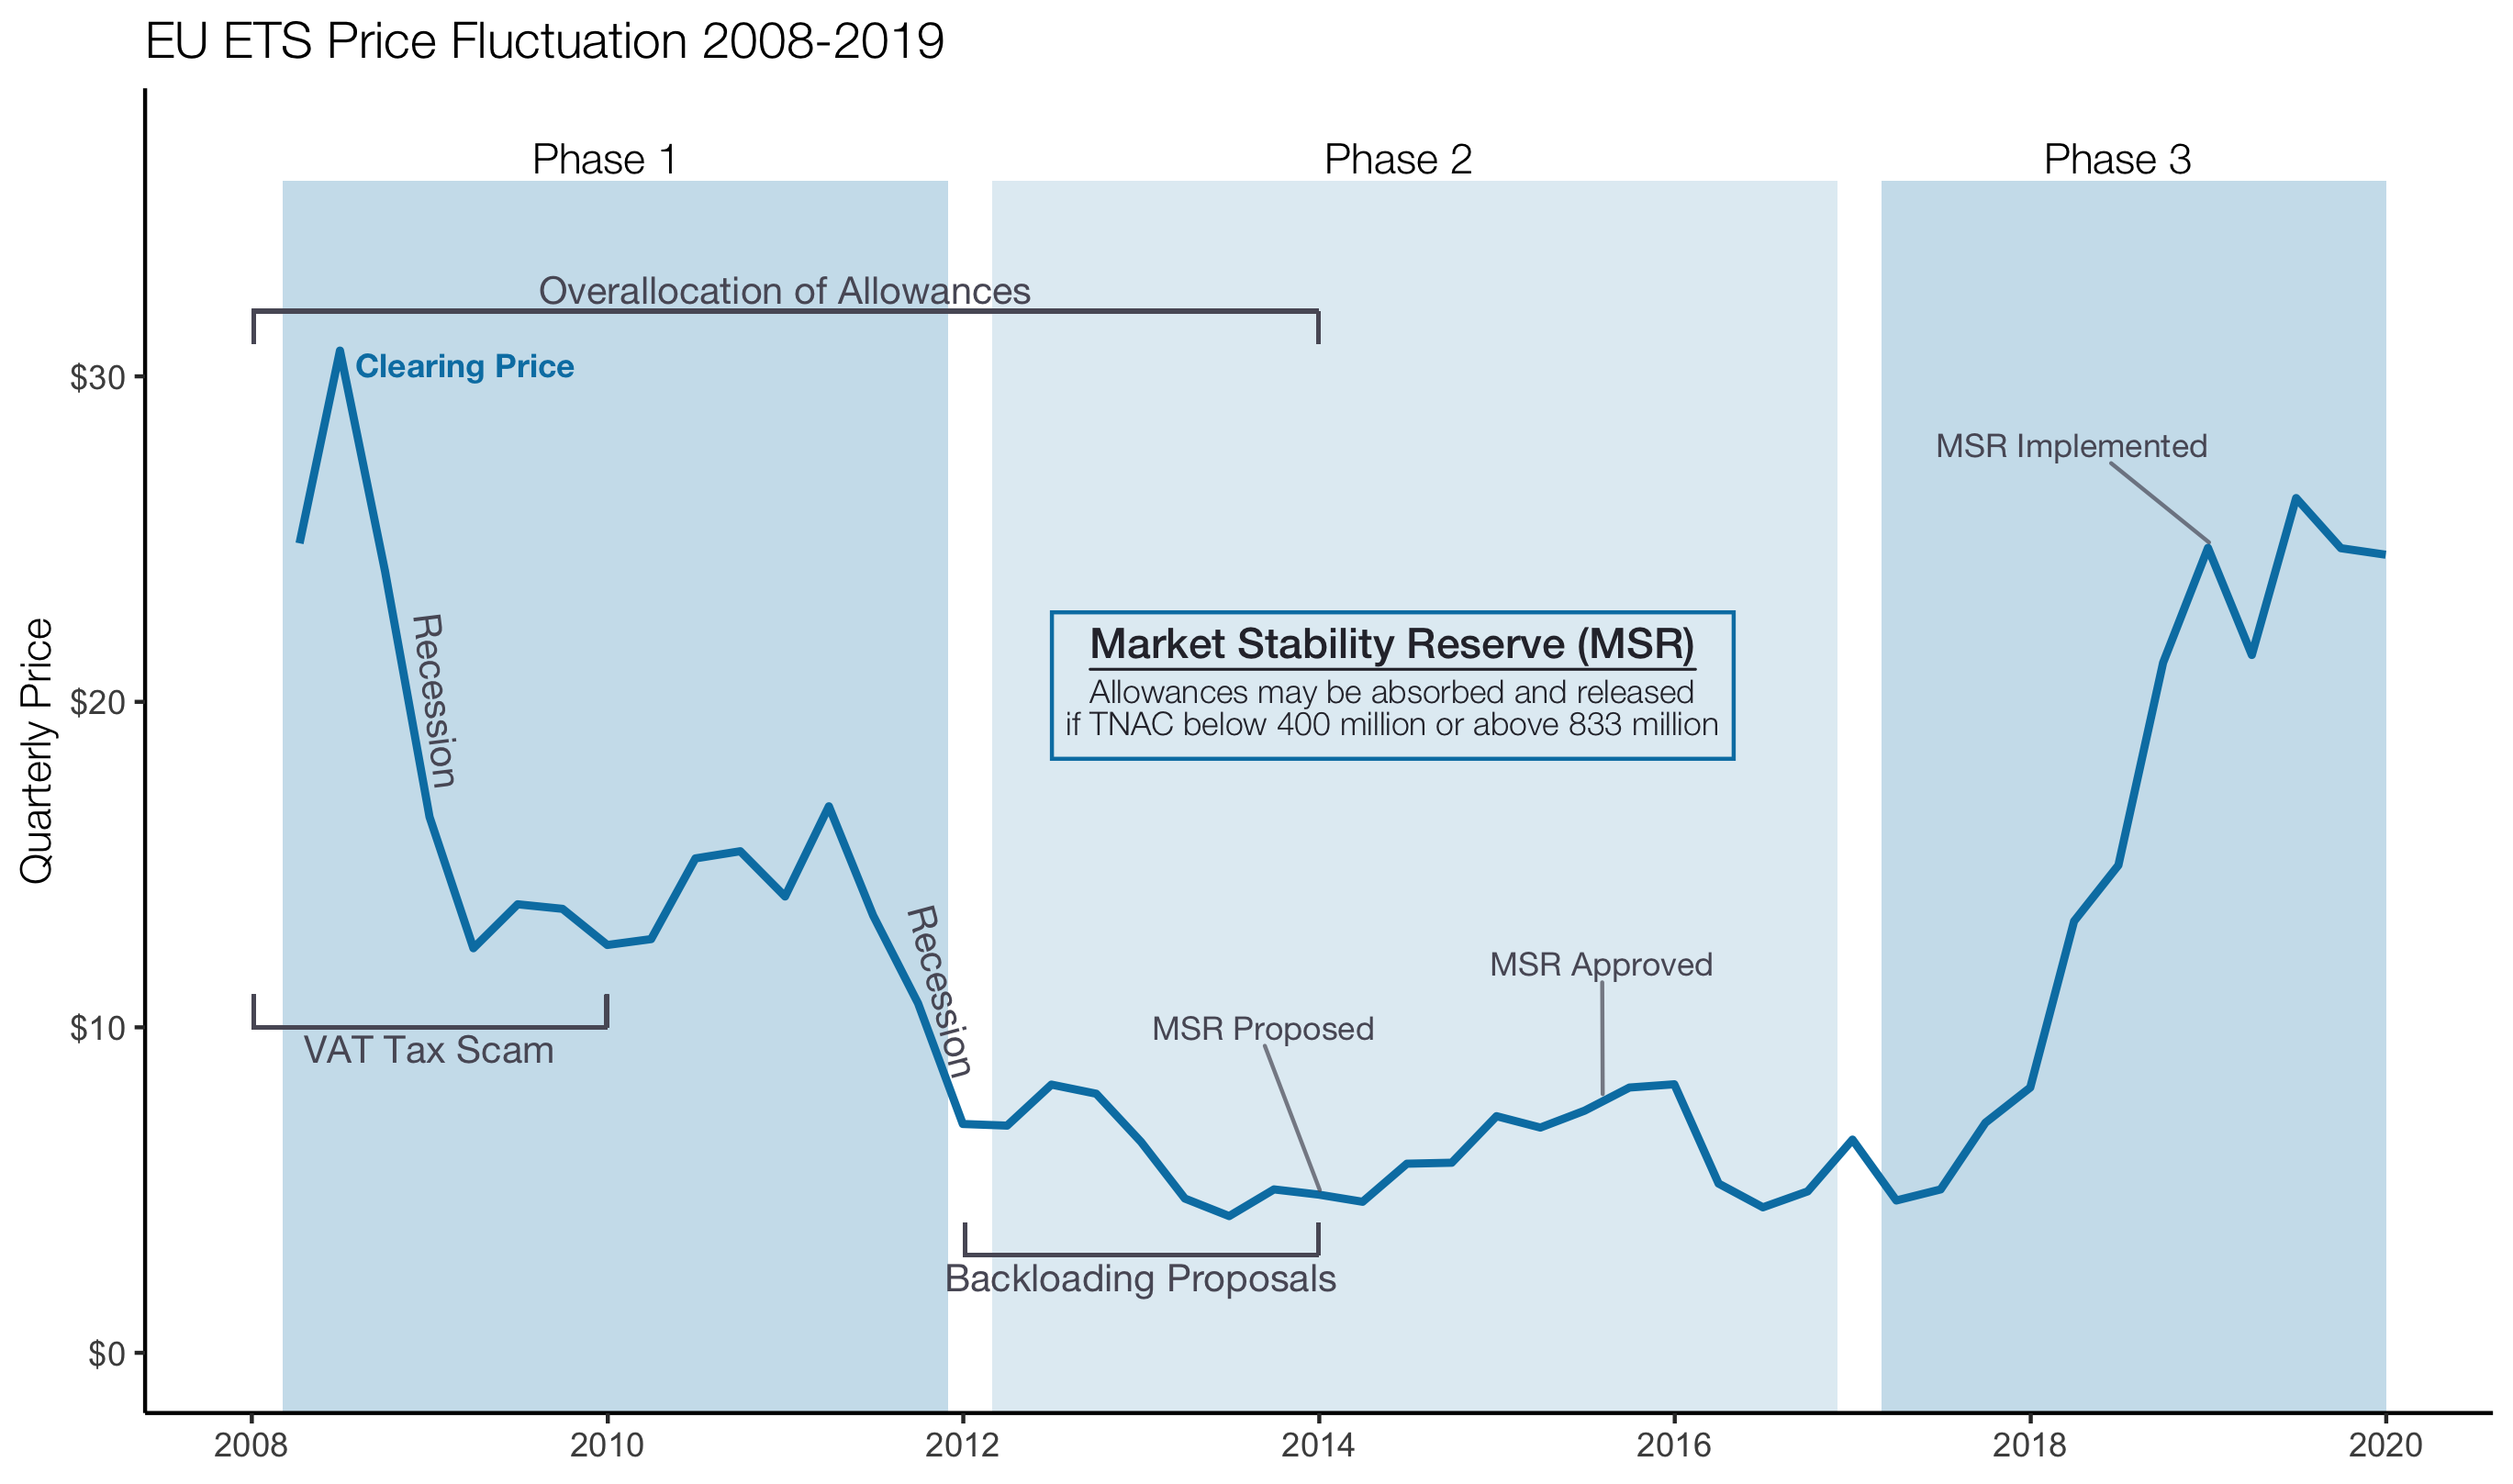
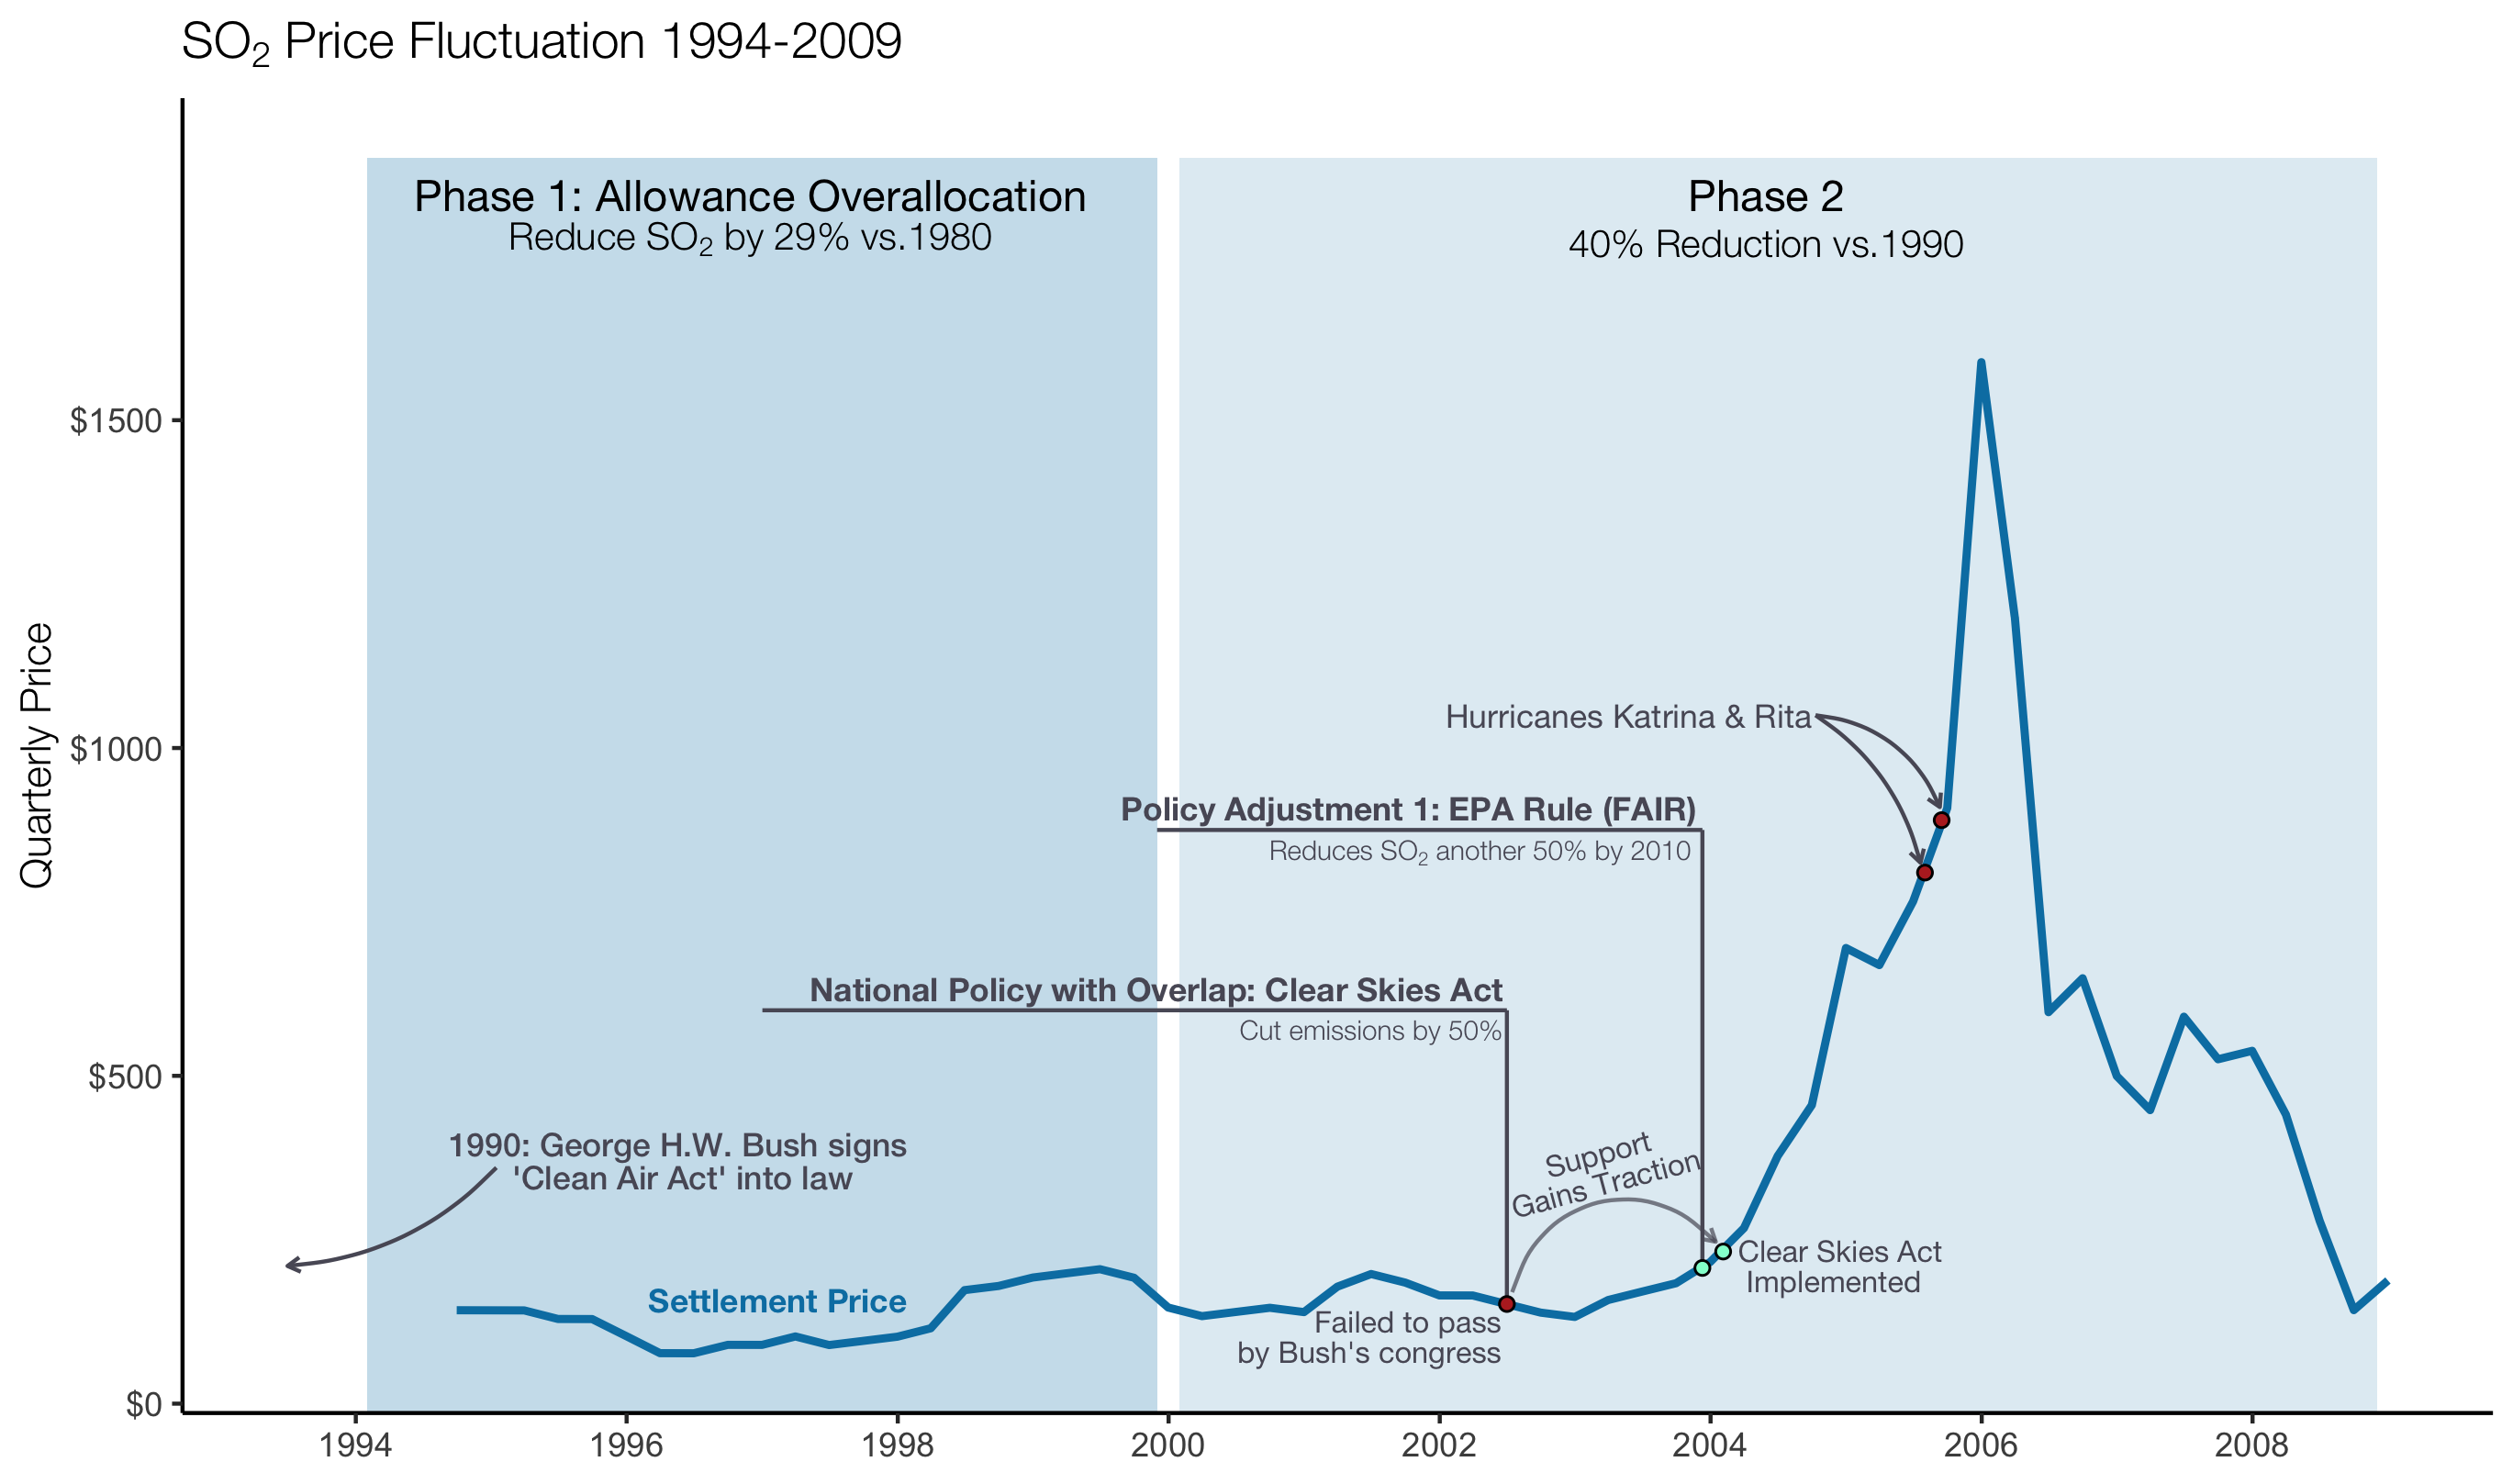
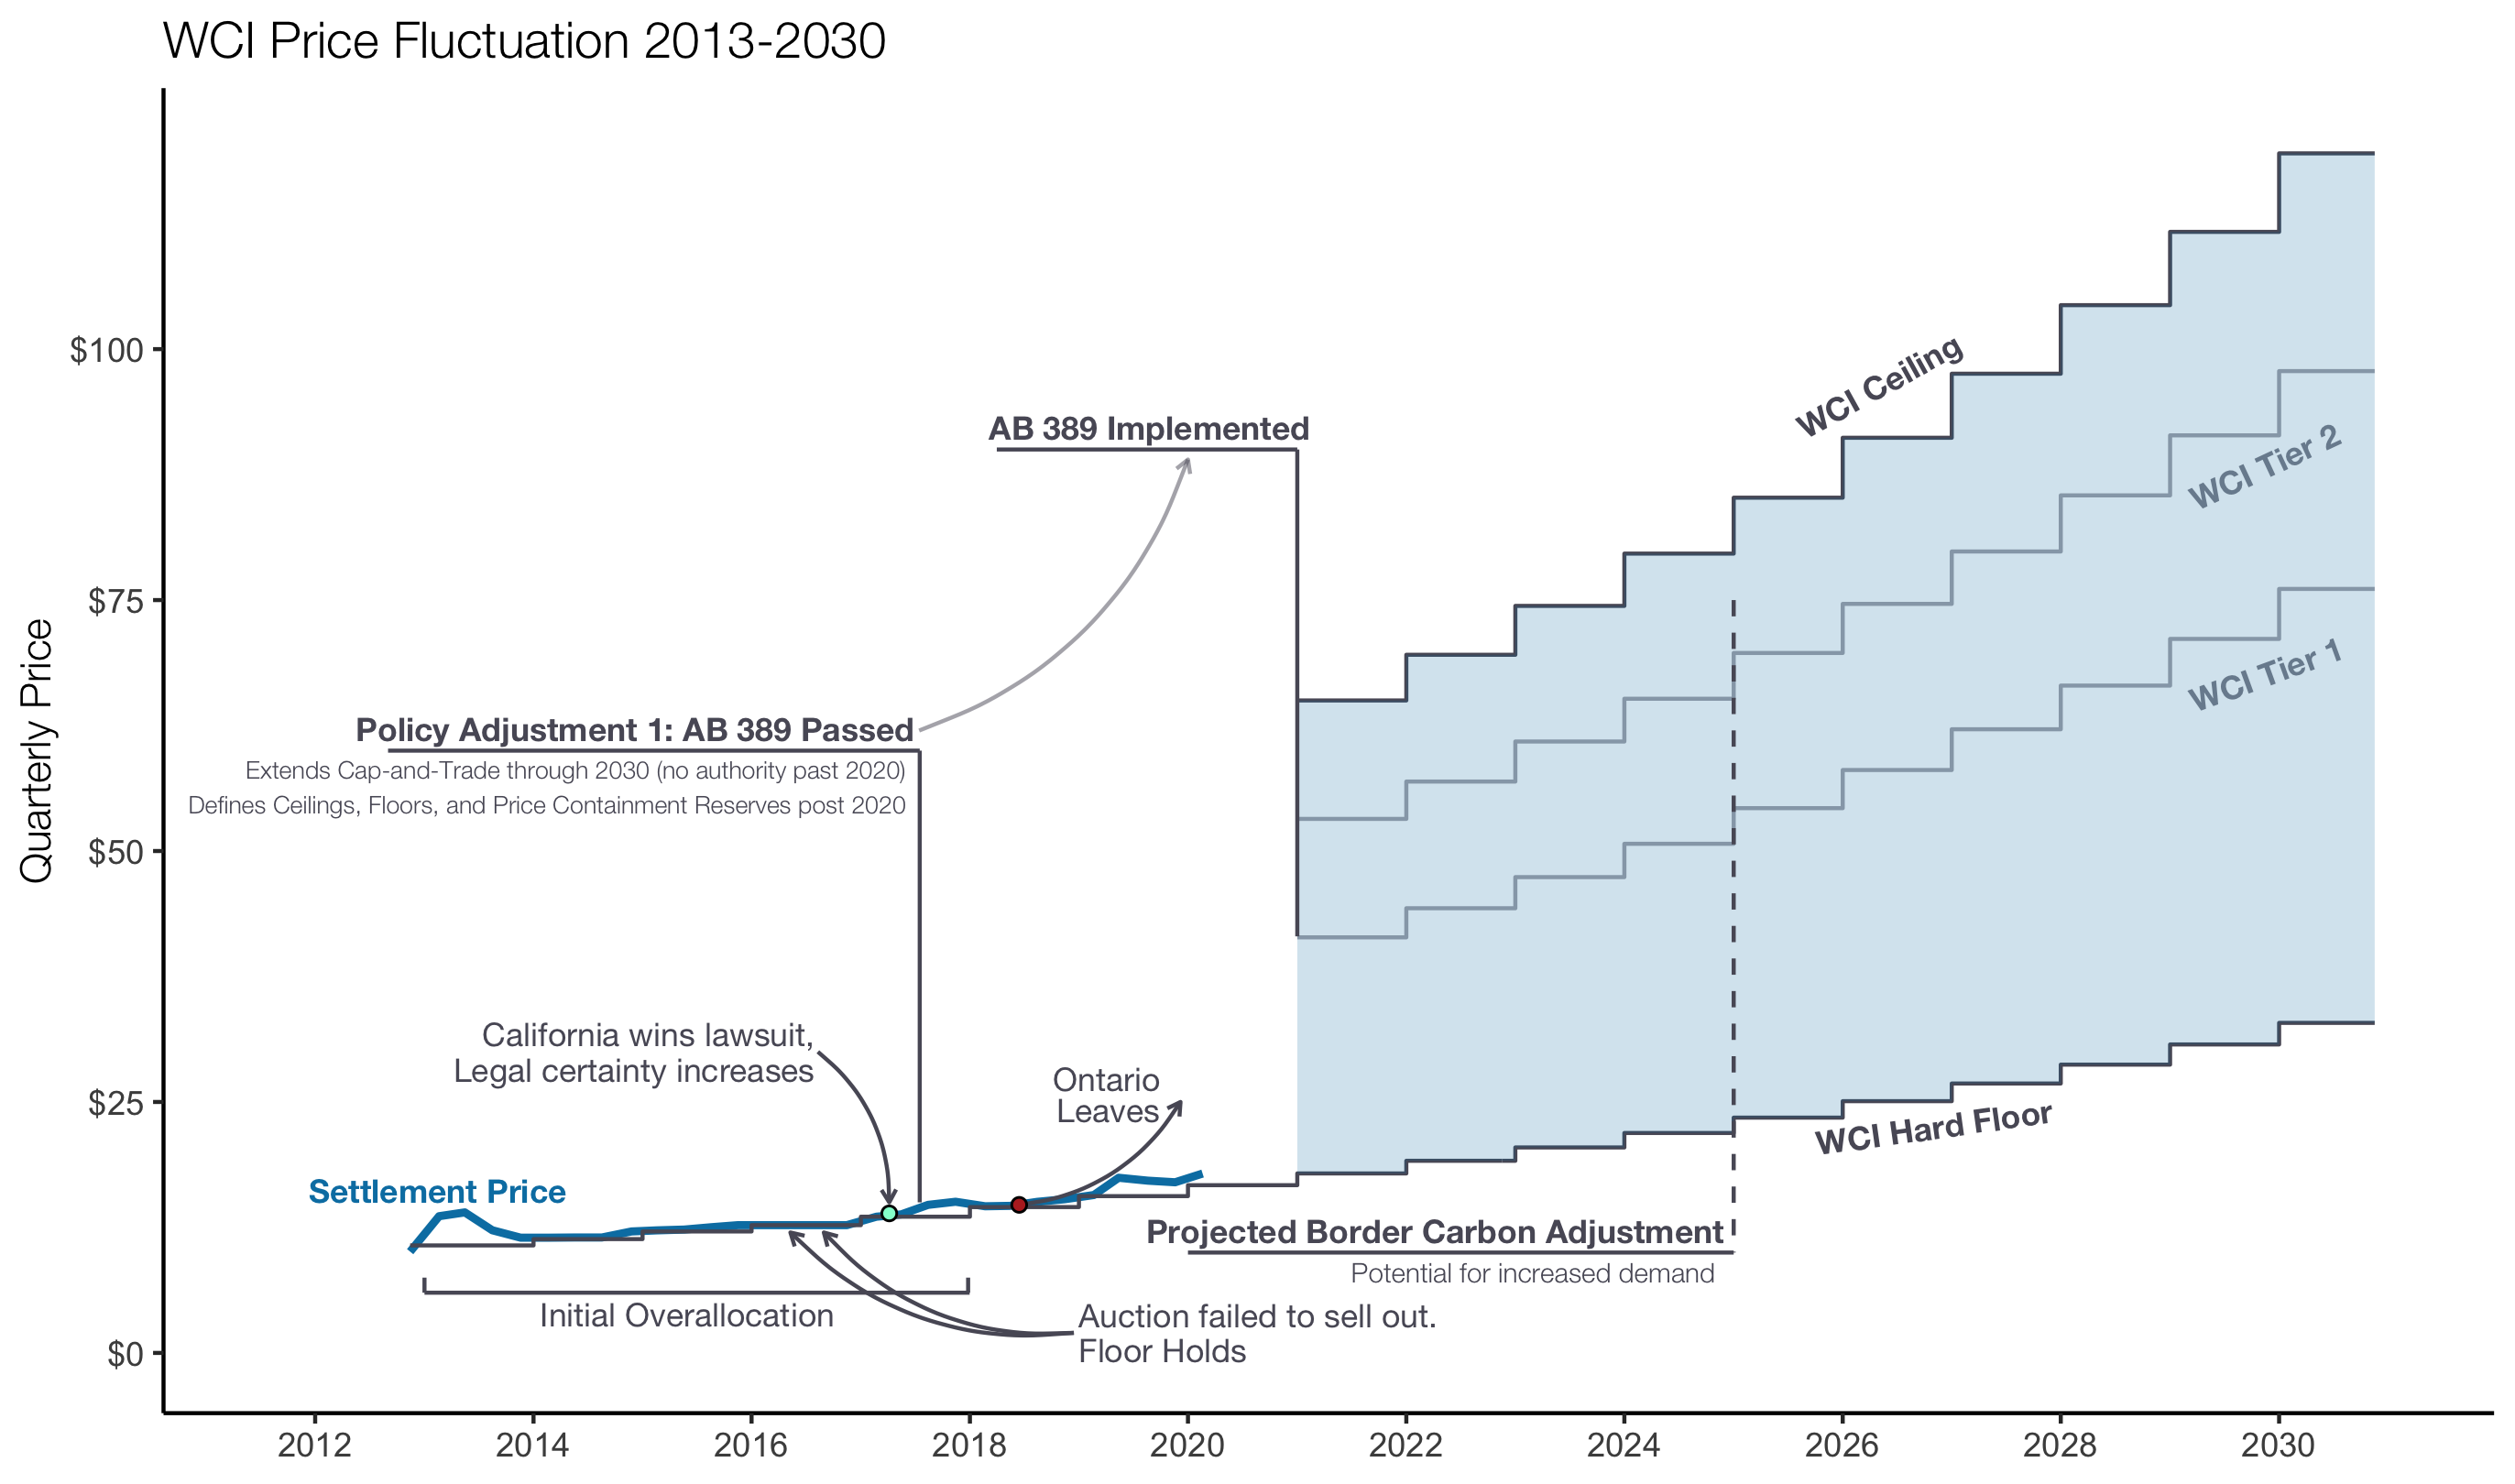
California Carbon Tax Markets
I made this series of plots for a California carbon tax consultancy to show changes in market prices of fossil fuel emissions in response to specific policy initiatives around the world. The events and acronyms denoted in these graphs are somewhat esoteric and were chosen by the client, but I focused on using clear annotations, color, and spacing to effectively communicate the client’s ideas. All plots were completed using ggplot2 and ggforce.

ACLU of Washington Community Survey Responses
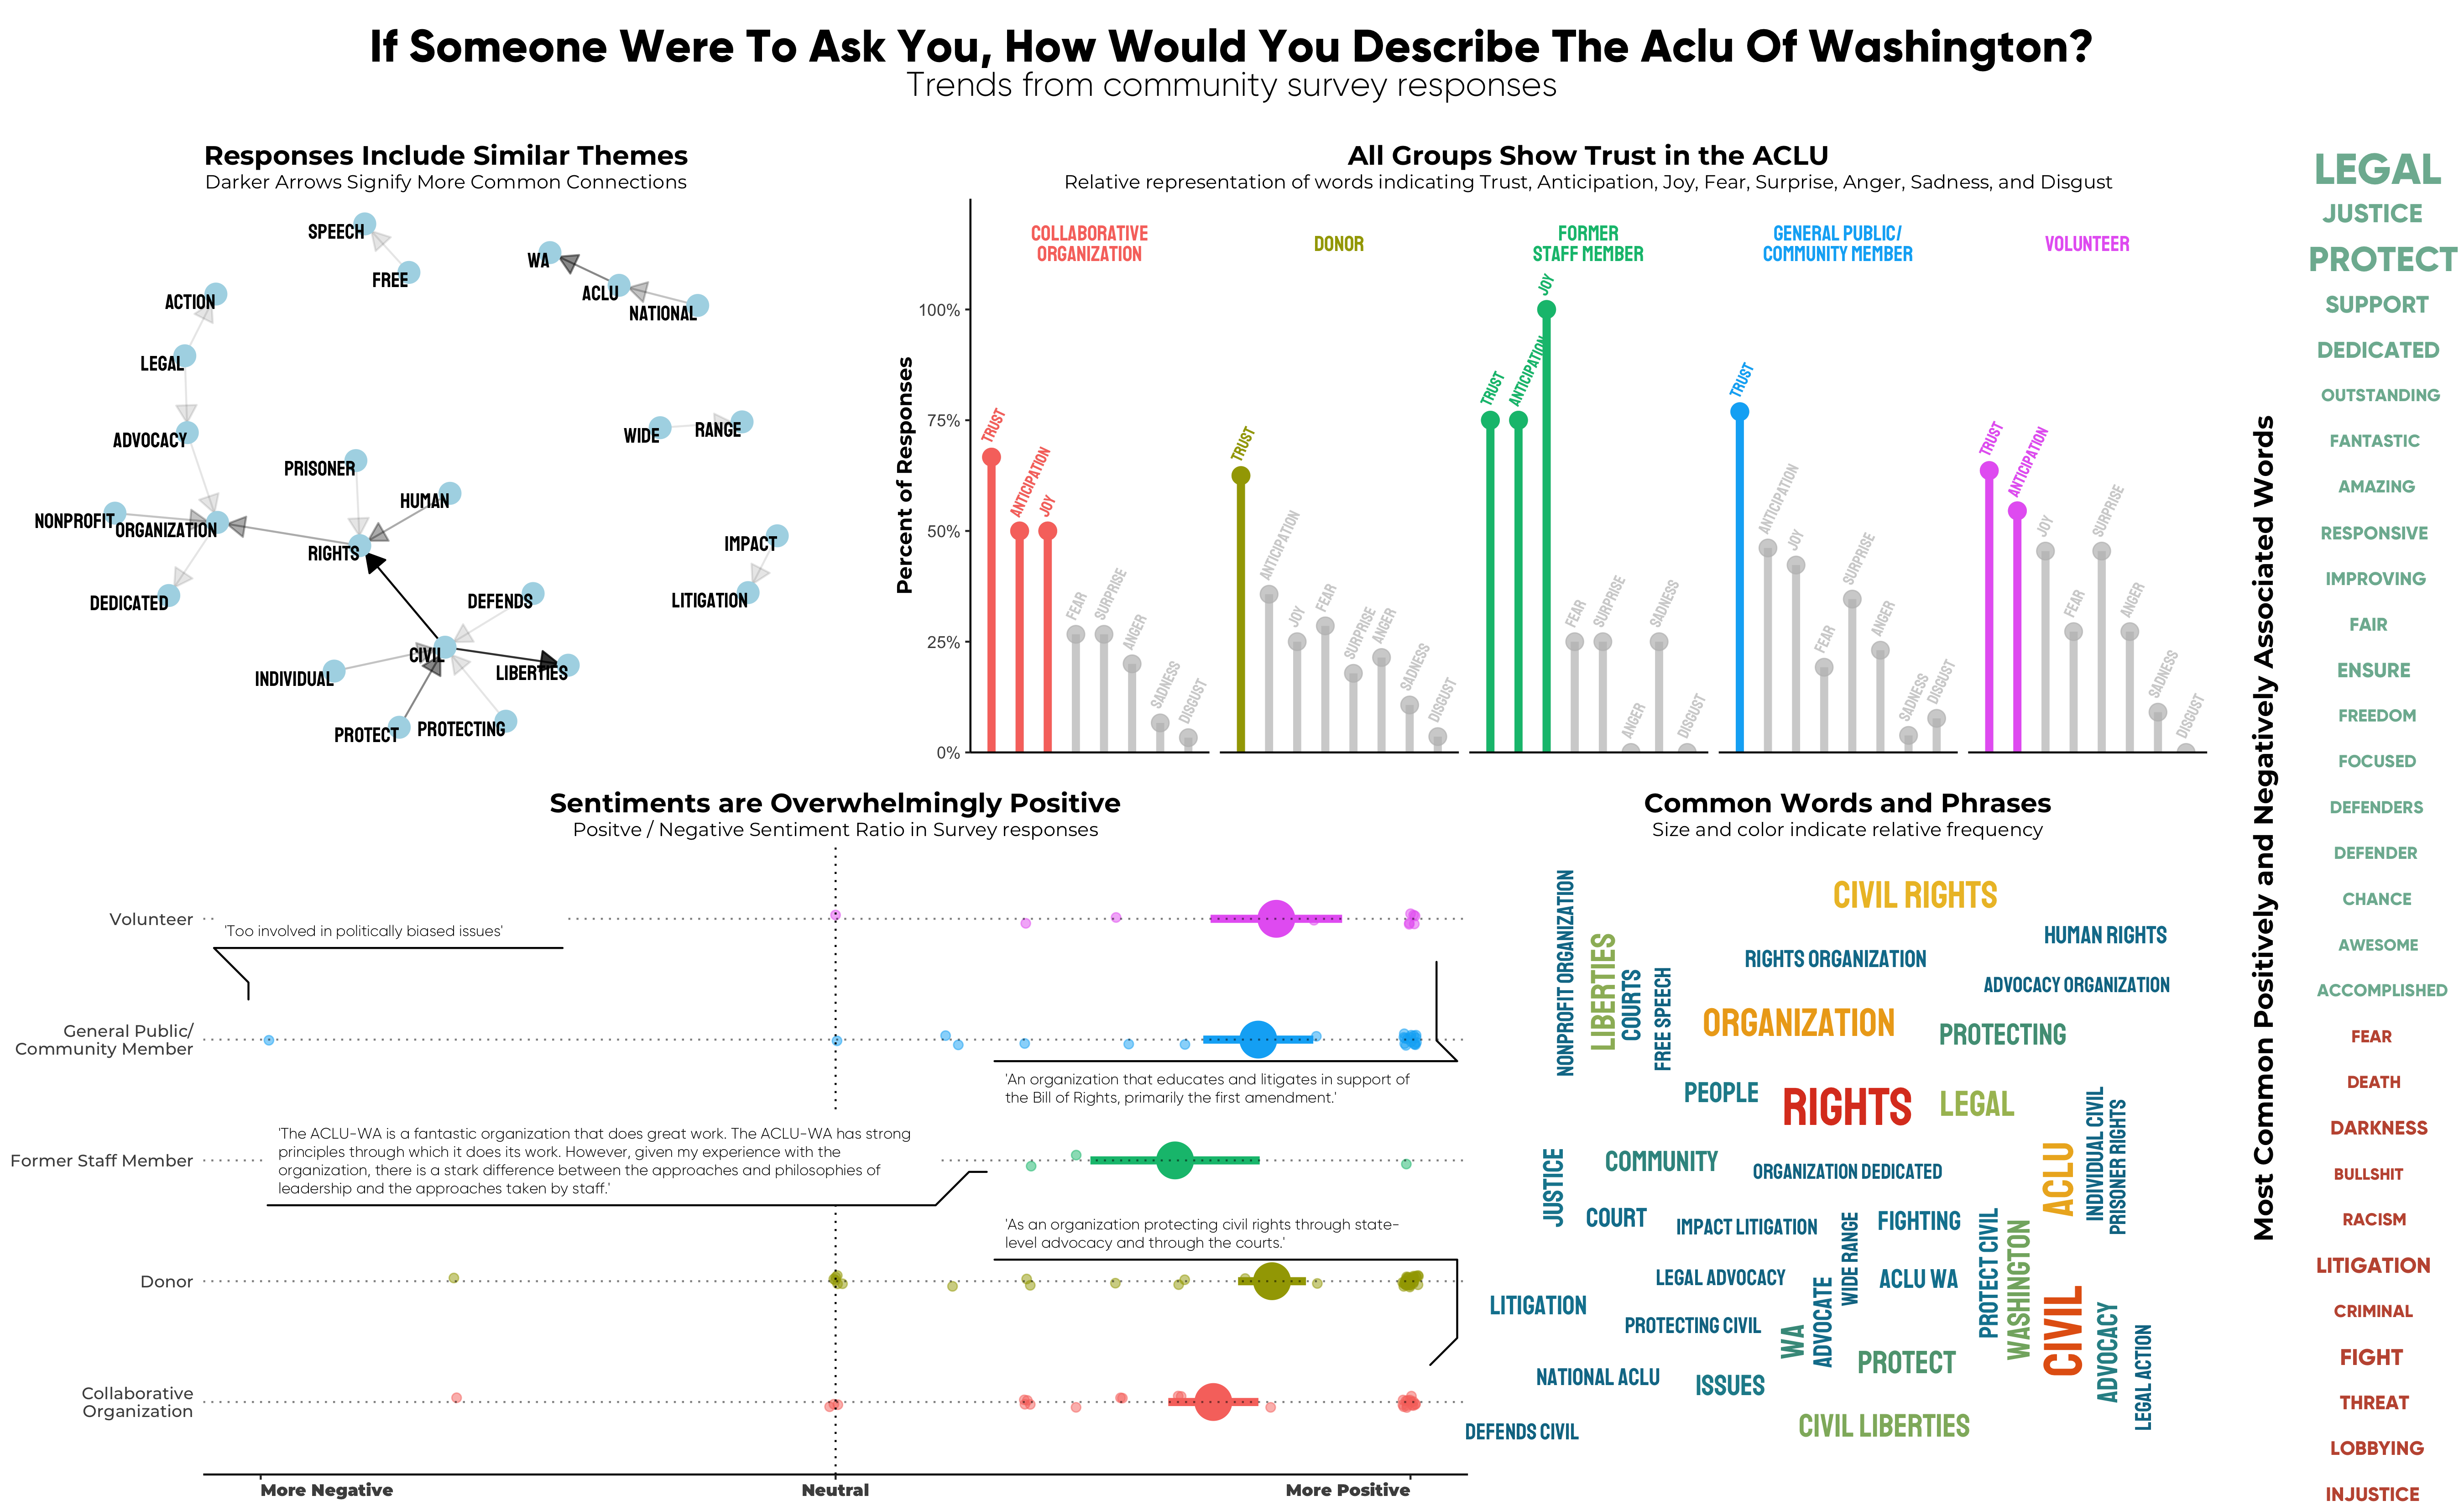
This is part of a freelance project I completed using text- and sentiment analysis to summarize responses to a community survey for the ACLU of Washington. I used the tidytext package for text manipulation and sentiment analysis, and ggplot2, ggforce, ggraph, and ggwordcloud for visualizations.
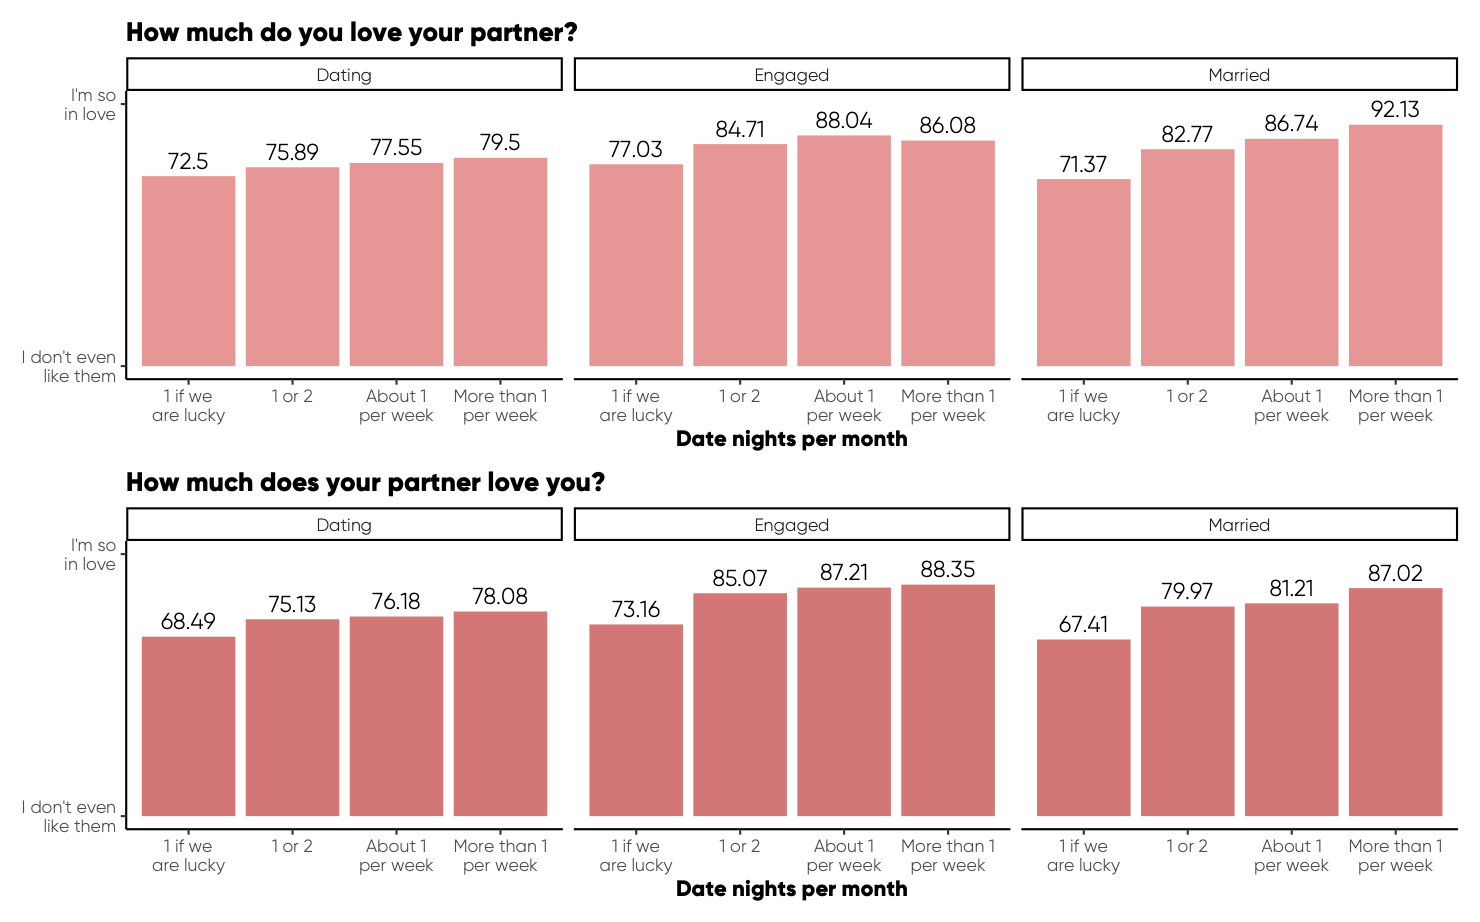
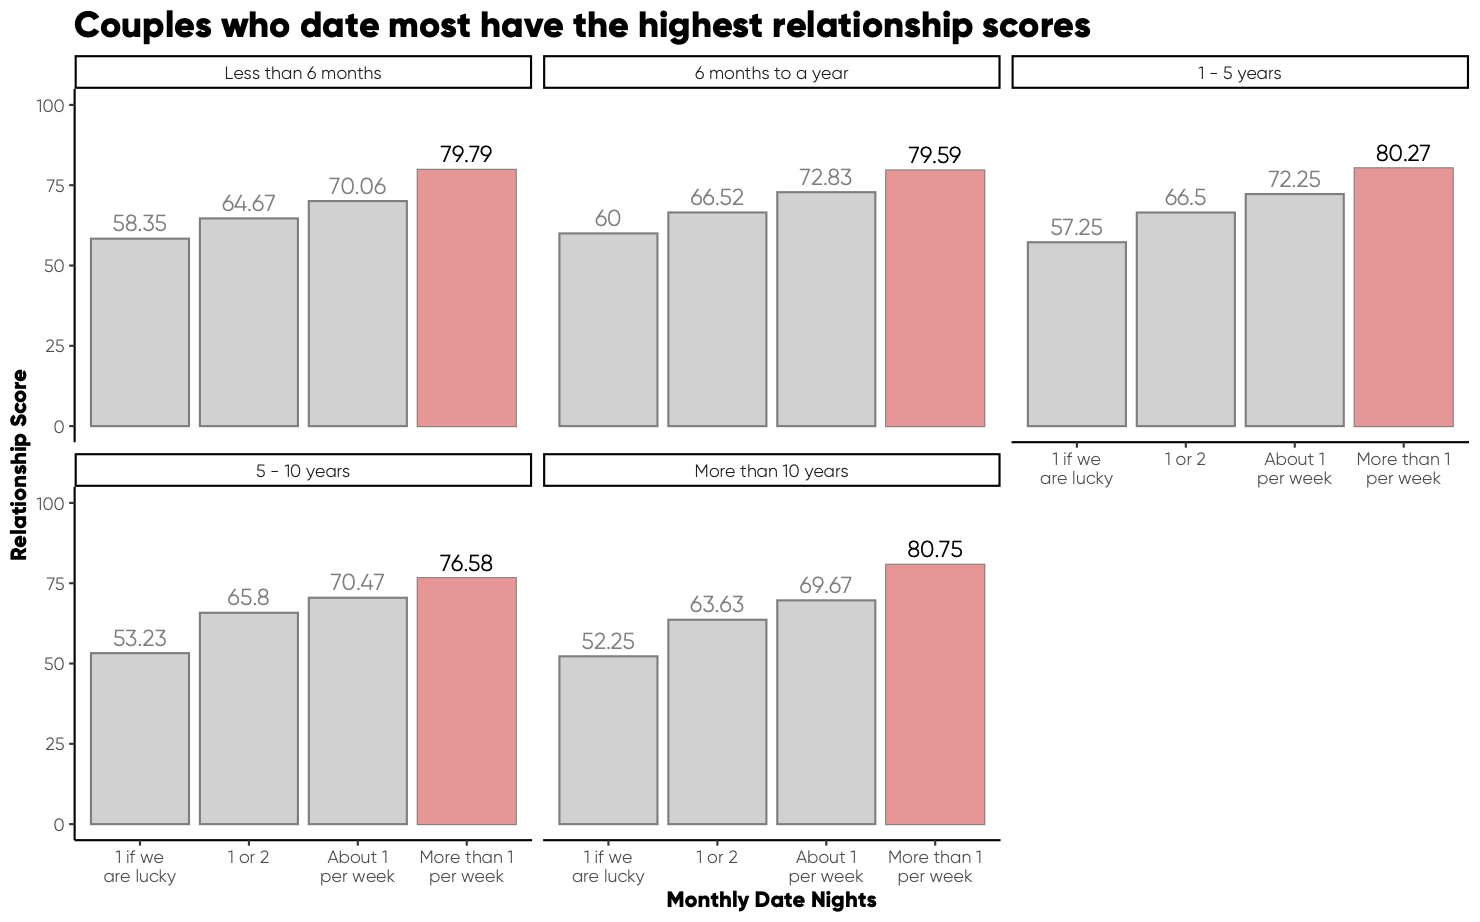
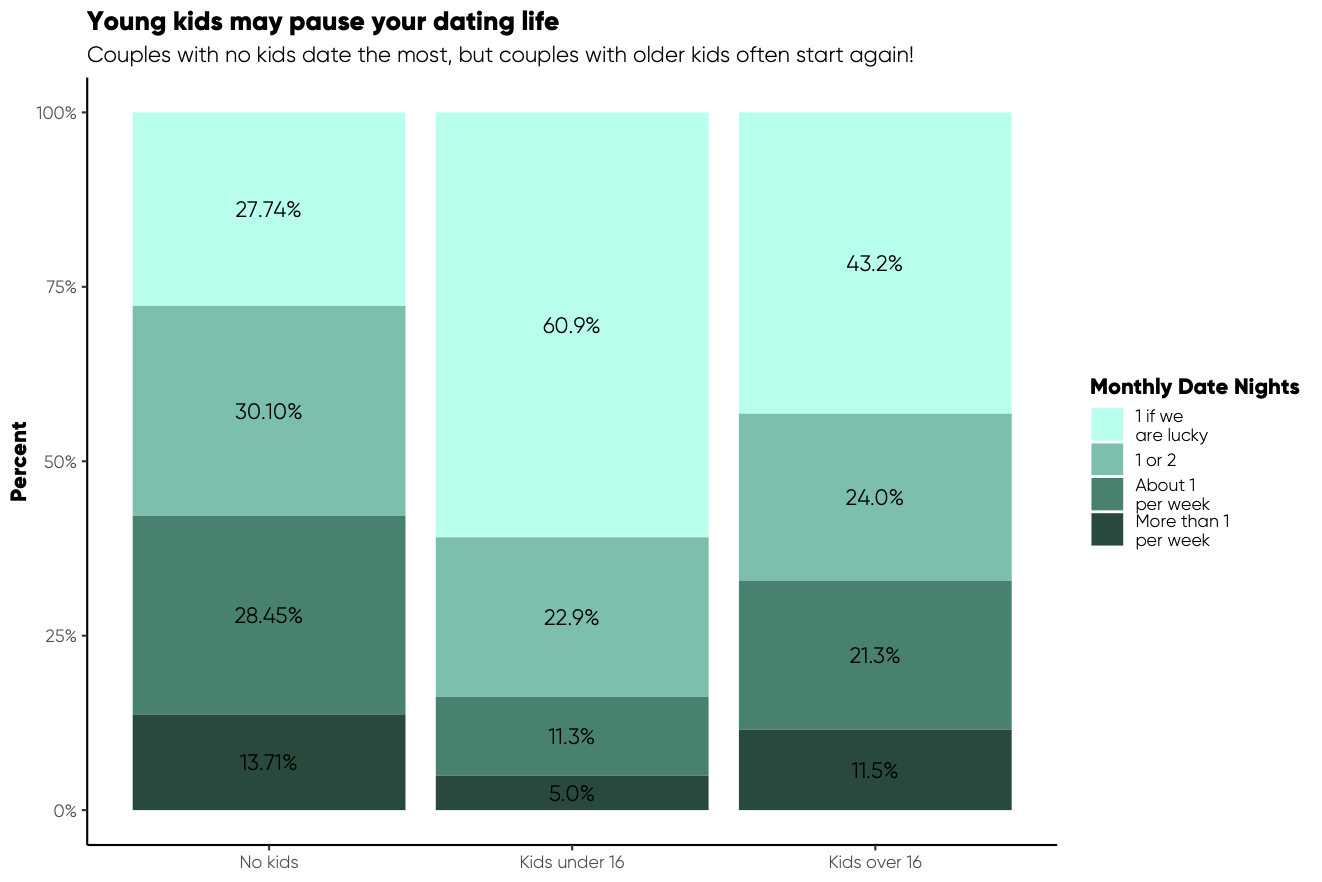
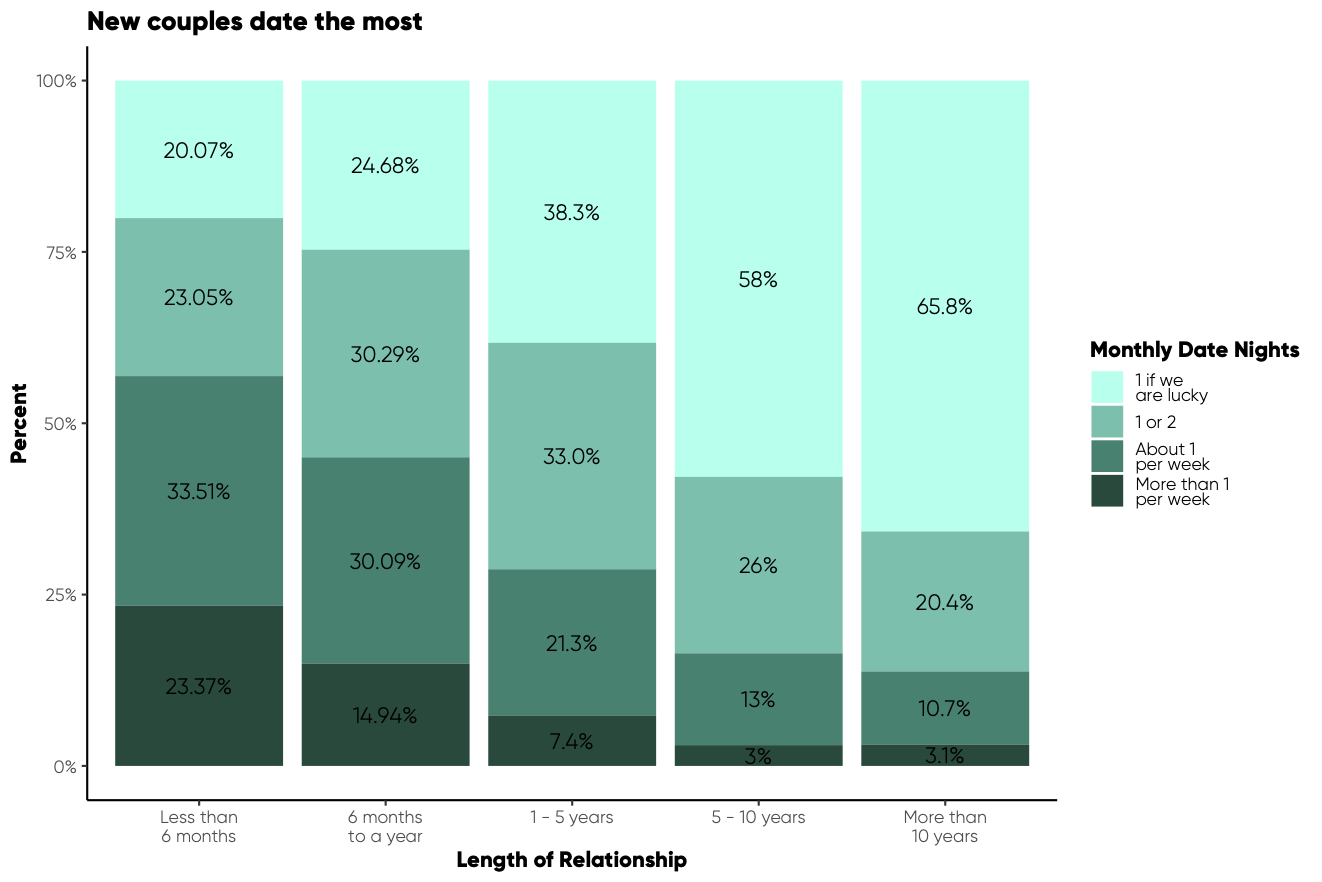
Crated with Love Relationship Survey
These are a subset of plots I created for Crated with Love food delivery service, summarizing results from a survey of ~10,000 couples on relationship- and date-night-related topics. These visualizations and results were used for marketing the importance of data nights to build and maintain healthy relationships.