Generative Art January - Increasing Randomness
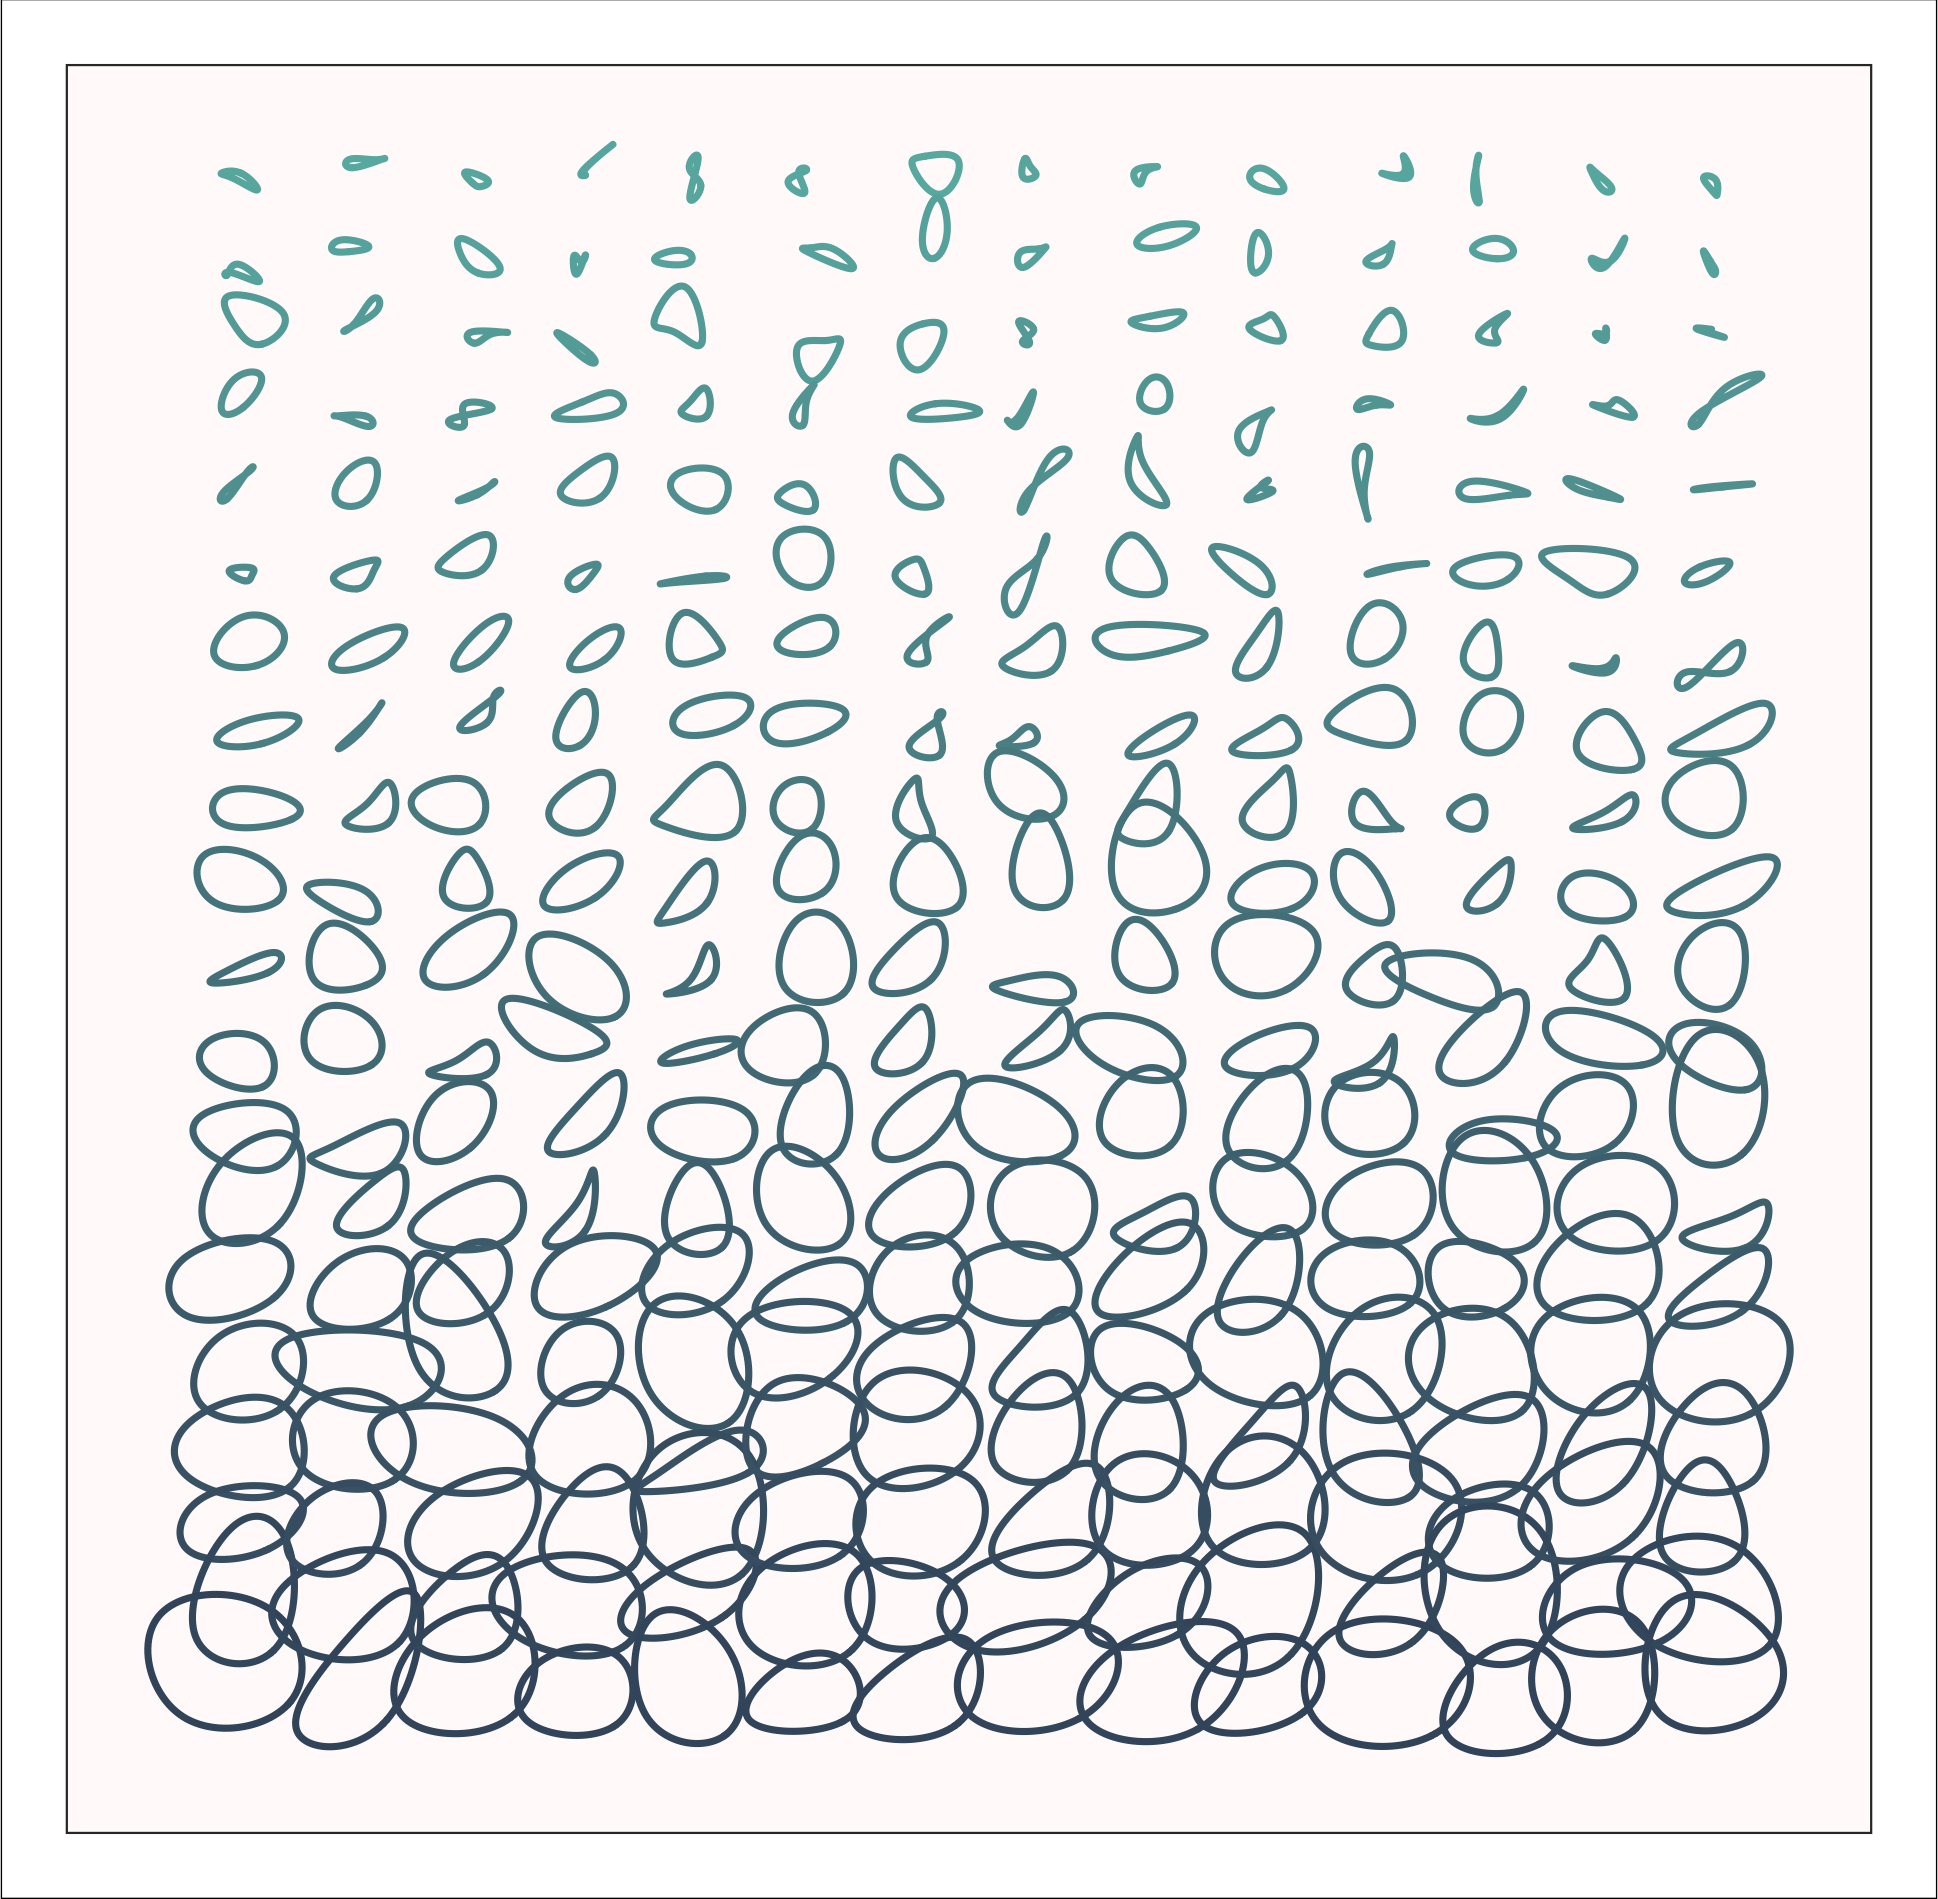
This plot was my first ever attempt at generative art, inspired by the #Genuary2021 community on twitter. The prompt on this day was: Increase the randomness along the Y-axis.
Basically, this code uses point coordinates spread evenly on a canvas, then expanded into 4 corners that will be the anchor points for geom_bspline_closed functions, which create the “circles” around each group of points. All groups of anchor points have some degree of randomness incorporated, but this randomness grows as a function of increased position on the Y axis.
Reproducible code here:
#-----------------------------------------------------------------------------
library(tidyverse)
library(ggforce)

n <- 20 # set number of circles
cols <- 14 # set number of columns

plot <-
  # make base grid
  data.frame(group=1:(n*cols),
                   basex=rep(c(1:cols),each=n)*4,
                   basey= (1:n)) %>%
  # generate randomness
  mutate(
    x = lapply(basey/2, function(x)
    {y = rnorm(4, basey, basey)
    x*c(-1, 1, 1, -1) + y}),
    y = lapply(basey/2, function(x)
    {y = rnorm(4, basey, basey)
    x*c(1, 1, -1, -1) + y})
  )  %>%
  unnest(cols = c(x,y)) %>%
  # add randomness to base grid and expand
  mutate(newy = y + basey*10.5,
         newx = x + basex*3.8) %>%
  # plot
  ggplot(aes(x=newx,y=newy,color=(newy),group=group,fill=(newy))) +
  geom_bspline_closed(show.legend = F,alpha=.7,size=.8,fill=NA) +
  coord_equal(expand = T)+
  theme_void()+
  # flip plot
  scale_y_reverse()+
  scale_color_gradient(high="#40556b",low="#67b5af")+
  theme(panel.background  = element_rect(color="grey20",fill="snow",size=.5),
        plot.background = element_rect(color="black",size=.3),
        plot.margin = margin(.55,.55,.55,.55,"cm"))

ggsave(plot, filename = here::here("R Projects","genuary19_3.55.png"),dpi=300)
#-----------------------------------------------------------------------------
