
Generative Art January
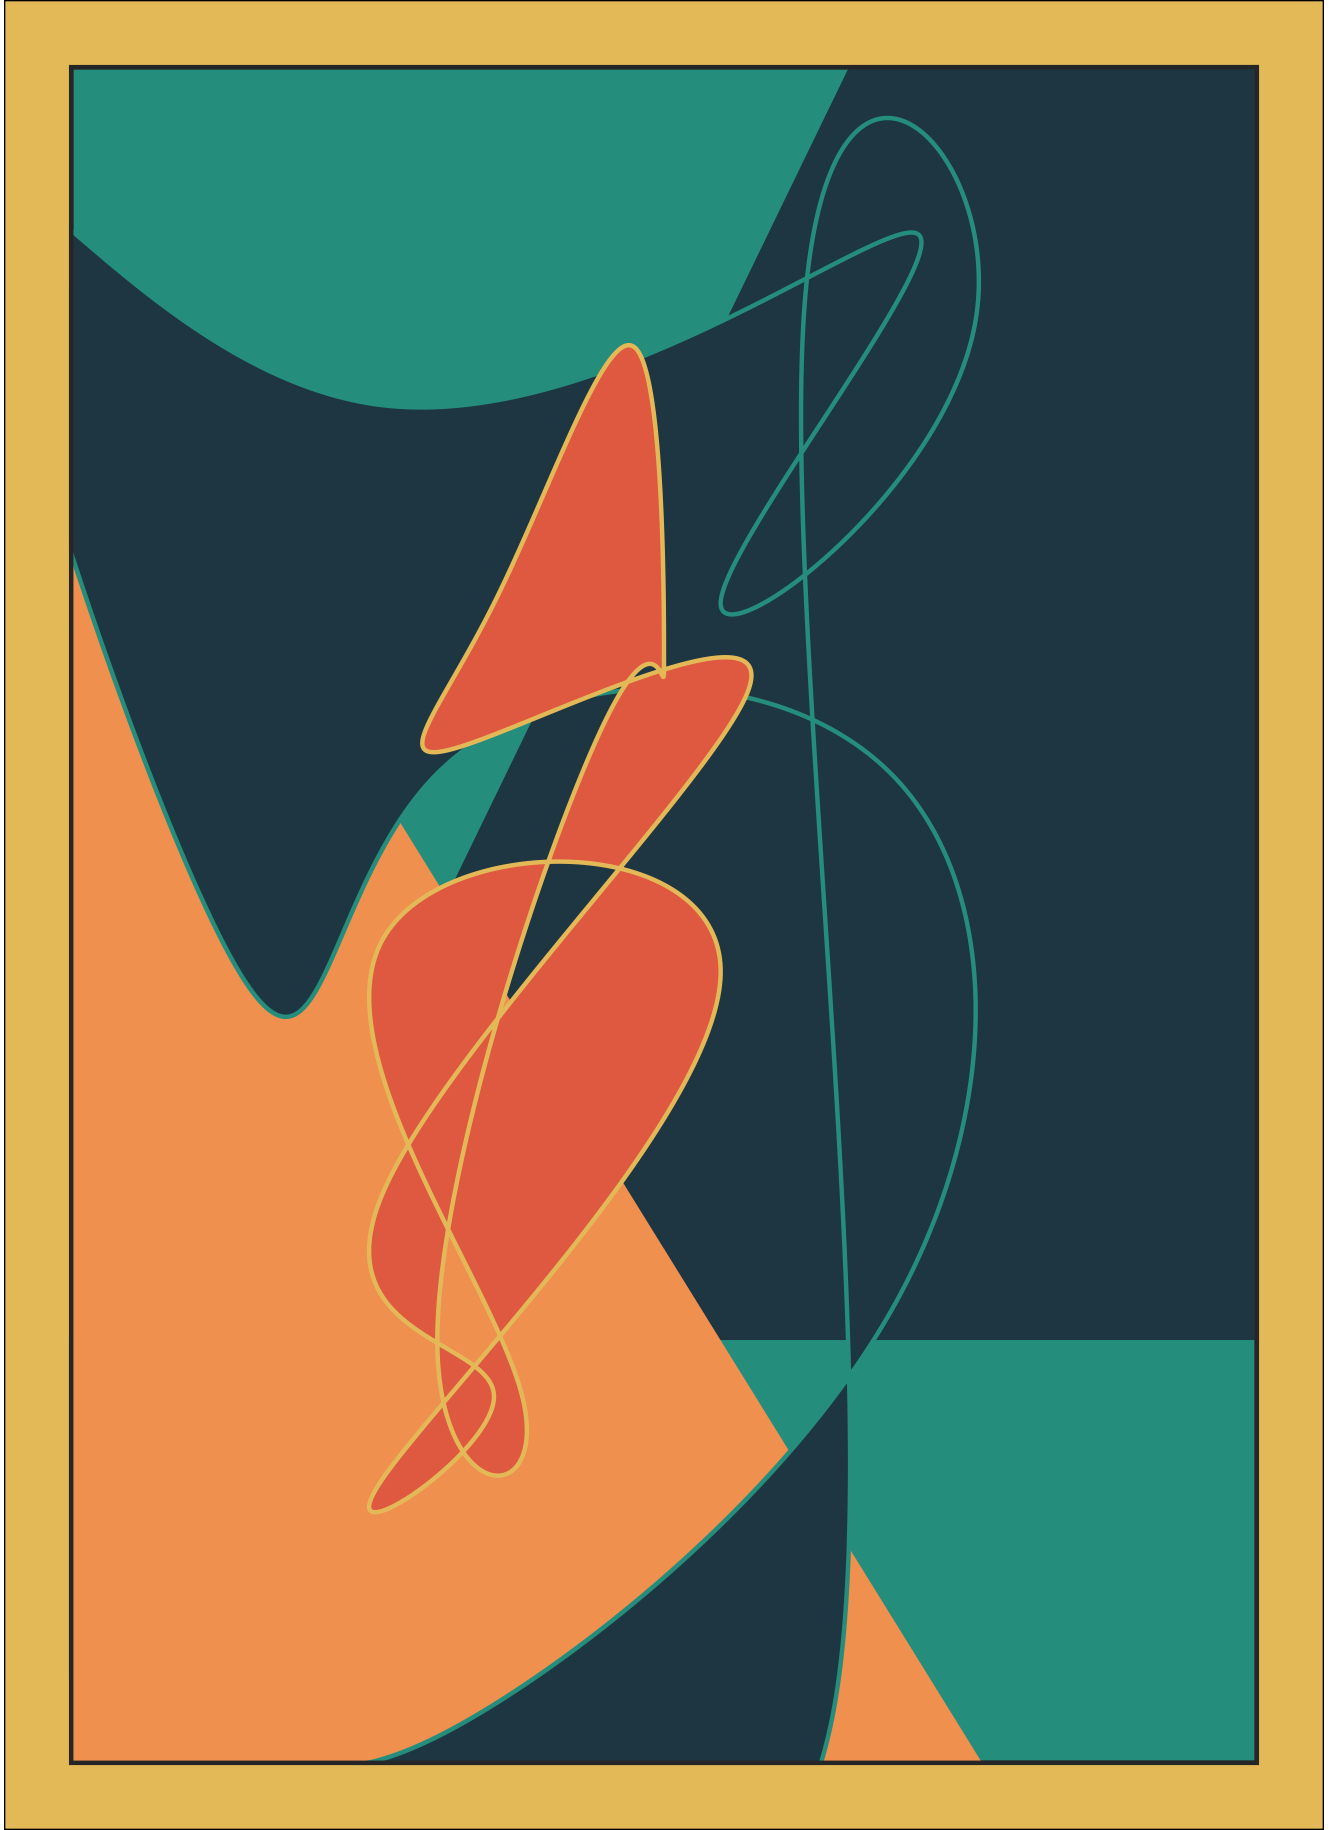
These visualizations represent my second attempt at generative art, inspired by the #Genuary2021 community on twitter. The prompt on this day was: Do anything with these 5 colors. Here, I made two different styles of visualized random data, with some parameters.
First, a modern-art-inspired piece using some geom_ribbons with random slopes behind two groups of randomly generated data points fitted with geom_bspline_closed functions creating curved objects. All colors are randomly chosen out of 5. Reproducible code here:
#-----------------------------------------------------------------------------
library(tidyverse)
library(ggforce)

# set some parameters
pal <- c("#264653", "#2a9d8f", "#e9c46a", "#f4a261", "#e76f51")
nrow <- 10
ncol <- 7
npoints <- 13

# create and print plot
{set.seed(1)
  p <- ggplot()+
    # add a triangle
    geom_ribbon(aes(y=c(0:(ncol+1)),
                    ymin=sample(10,1),
                    ymax=(runif(1,0,3)*c(0:(ncol+1))),
                    x=c(0:(ncol+1))),
                fill=pal[sample(1:5,1)])+
    # and another
    geom_ribbon(aes(y=c(0:(ncol+1)),
                    ymin=-5,
                    ymax=(runif(1,-2,-1)*c(0:(ncol+1))+nrow),
                    x=c(0:(ncol+1))),
                fill=pal[sample(1:5,1)]) +
    # add curved shapes
    geom_bspline_closed(aes(x = sample((0-2):(ncol+2), npoints, replace = T),
                            y = sample( (0-2):(nrow+2), npoints, replace = T)),
                        fill=pal[sample(1:5,1)],
                        color=pal[sample(1:5,1)],
                        n=1000) +
    geom_bspline_closed(aes(x = sample(1:(ncol-1), npoints, replace = T),
                            y = sample( nrow, npoints, replace = T)),
                        fill=pal[sample(1:5,1)],
                        color=pal[sample(1:5,1)],
                        n=1000) +

    # add a frame
    geom_rect(aes(xmin=0.5,
                  xmax=ncol+.5,
                  ymin=0.5,
                  ymax=nrow+.5),
              color="grey20",
              fill=NA,
              size=1)+

    scale_fill_manual(values=pal) +
    scale_color_manual(values=pal) +
    theme_void() +
    theme(panel.background = element_rect(color="grey20", fill=pal[sample(1:5,1)],
                                          #fill="white",
                                          size=1
    ),
    legend.position = "none",
    plot.background = element_rect(color="black",size=.3,fill=pal[sample(1:5,1)]),
    plot.margin = margin(.55,.55,.55,.55,"cm"))+

    coord_equal(xlim = c(0.5,ncol+.5),
                ylim = c(0.5,nrow+.5),
                expand = F)
  print(p)

  # remove the pound signs below to save the plot
  #ggsave(filename = here::here("p.png"),
  #       width = 4.6,
  #       height = 6.1,
  #       dpi=300)
}
#-----------------------------------------------------------------------------
Second, a geometric collection of geoms using coordinates randomly sampled from a 7x10 coordinate plane.
#-----------------------------------------------------------------------------
library(tidyverse)

# create some parameters
nrow <- 10
ncol <- 7
pal <- c("#264653", "#2a9d8f", "#e9c46a", "#f4a261", "#e76f51")
nsquares <- 25
ncircles <- 12
ncircles2 <- 15
radius=.5

# make plot
#----------------------------------------------------
{set.seed(7) # change seed number for different random data
  plot <- ggplot() +

    # add random squares
    geom_rect(aes(xmin=sample(ncol, nsquares, replace = T),
                  xmax = sample(ncol, nsquares, replace = T),
                  ymin=sample( nrow, nsquares, replace = T),
                  ymax=sample( nrow, nsquares, replace = T),
                  fill=sample(pal, nsquares, replace=T))) +

    # add random circles
    geom_circle(aes(x0=sample(ncol, ncircles, replace = T),
                    y0=sample(nrow, ncircles, replace = T),
                    r = radius,
                    fill= sample(pal, ncircles, replace=T),
                    color=sample(pal, ncircles, replace=T)),
                size=2) +


    # add smaller random circles
    geom_circle(data =  data.frame(x = sample(ncol, ncircles2, replace = T),
                                   y = sample( nrow, ncircles2, replace = T),
                                   color = sample(pal, ncircles2, replace=T)),
                aes(x0=x,y0=y,r=(radius-.2),color=color),fill="transparent",size=3) +

    coord_equal(xlim = c(0.5,ncol+.5),
                ylim = c(0.5,nrow+.5))+

    scale_fill_manual(values=pal) +
    scale_color_manual(values=pal) +
    theme_void() +
    theme(panel.background = element_rect(color="grey20", fill=pal[sample(1:5,1)]),
          legend.position = "none",
          plot.background = element_rect(color="black",size=.3,fill=pal[sample(1:5,1)]),
          plot.margin = margin(.55,.55,.55,.55,"cm"))
  print(plot)
  #ggsave(filename =here::here("plot.png"),
  #       width = 4.6,
  #       height = 6.1,
  #       dpi=300)
}
#-----------------------------------------------------------------------------