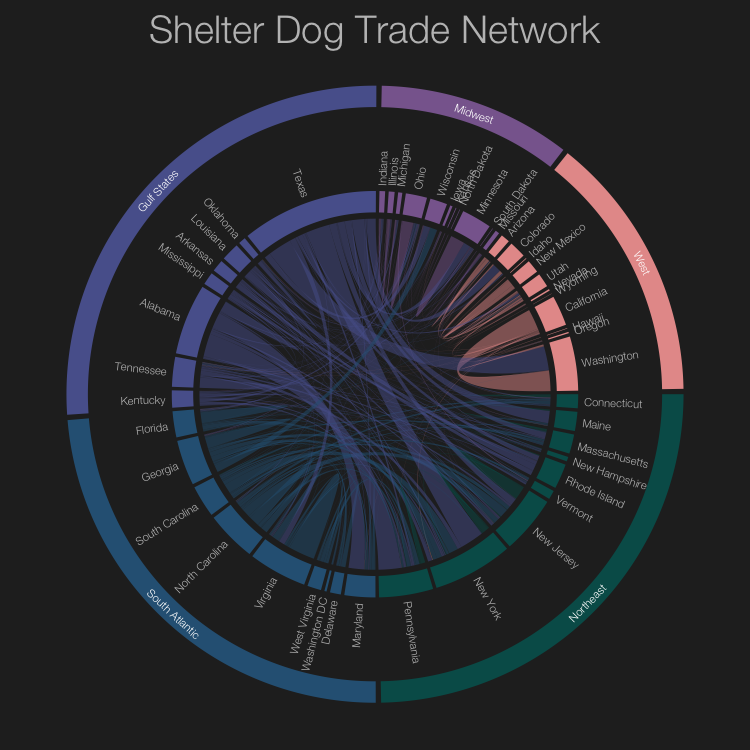
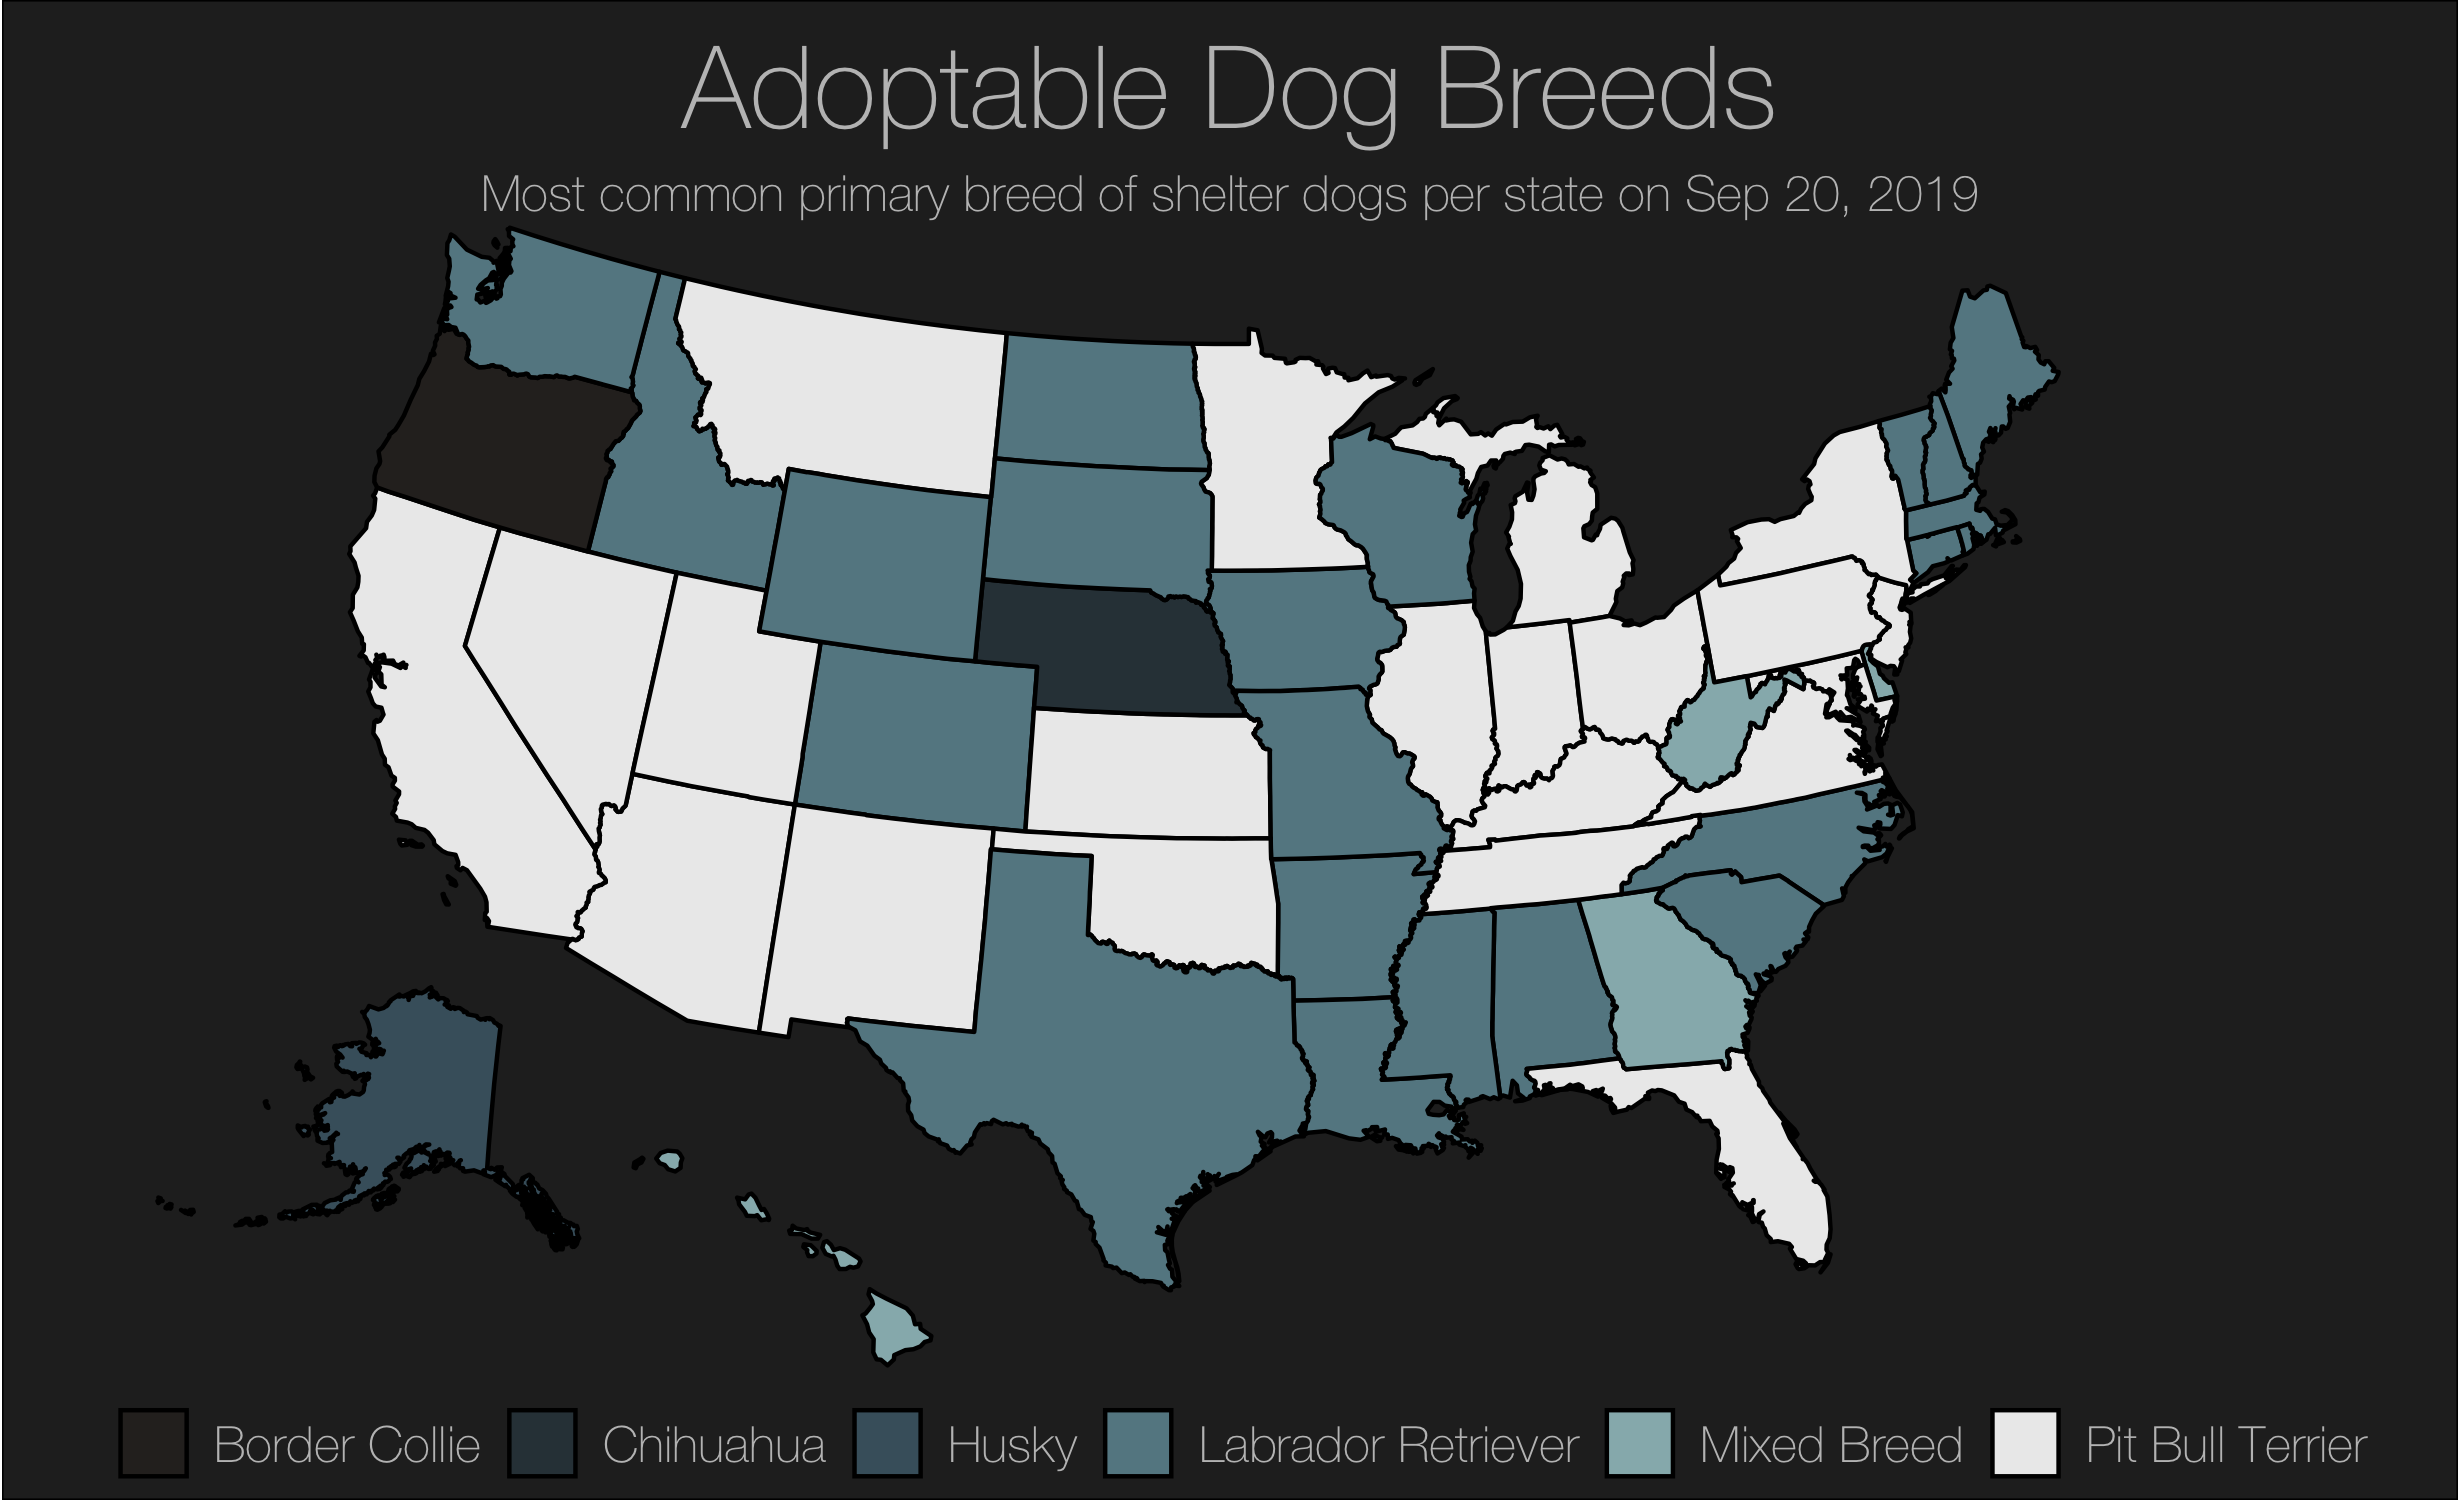
Visualizing the supply chain of US shelter dogs.
This plot is one of my first contributions to the #TidyTuesday R social project. Here, I developed a chord plot of shelter dog origins vs destinations, then a map of the most common shelter dog breeds per state. Code available at GitHub link in banner.