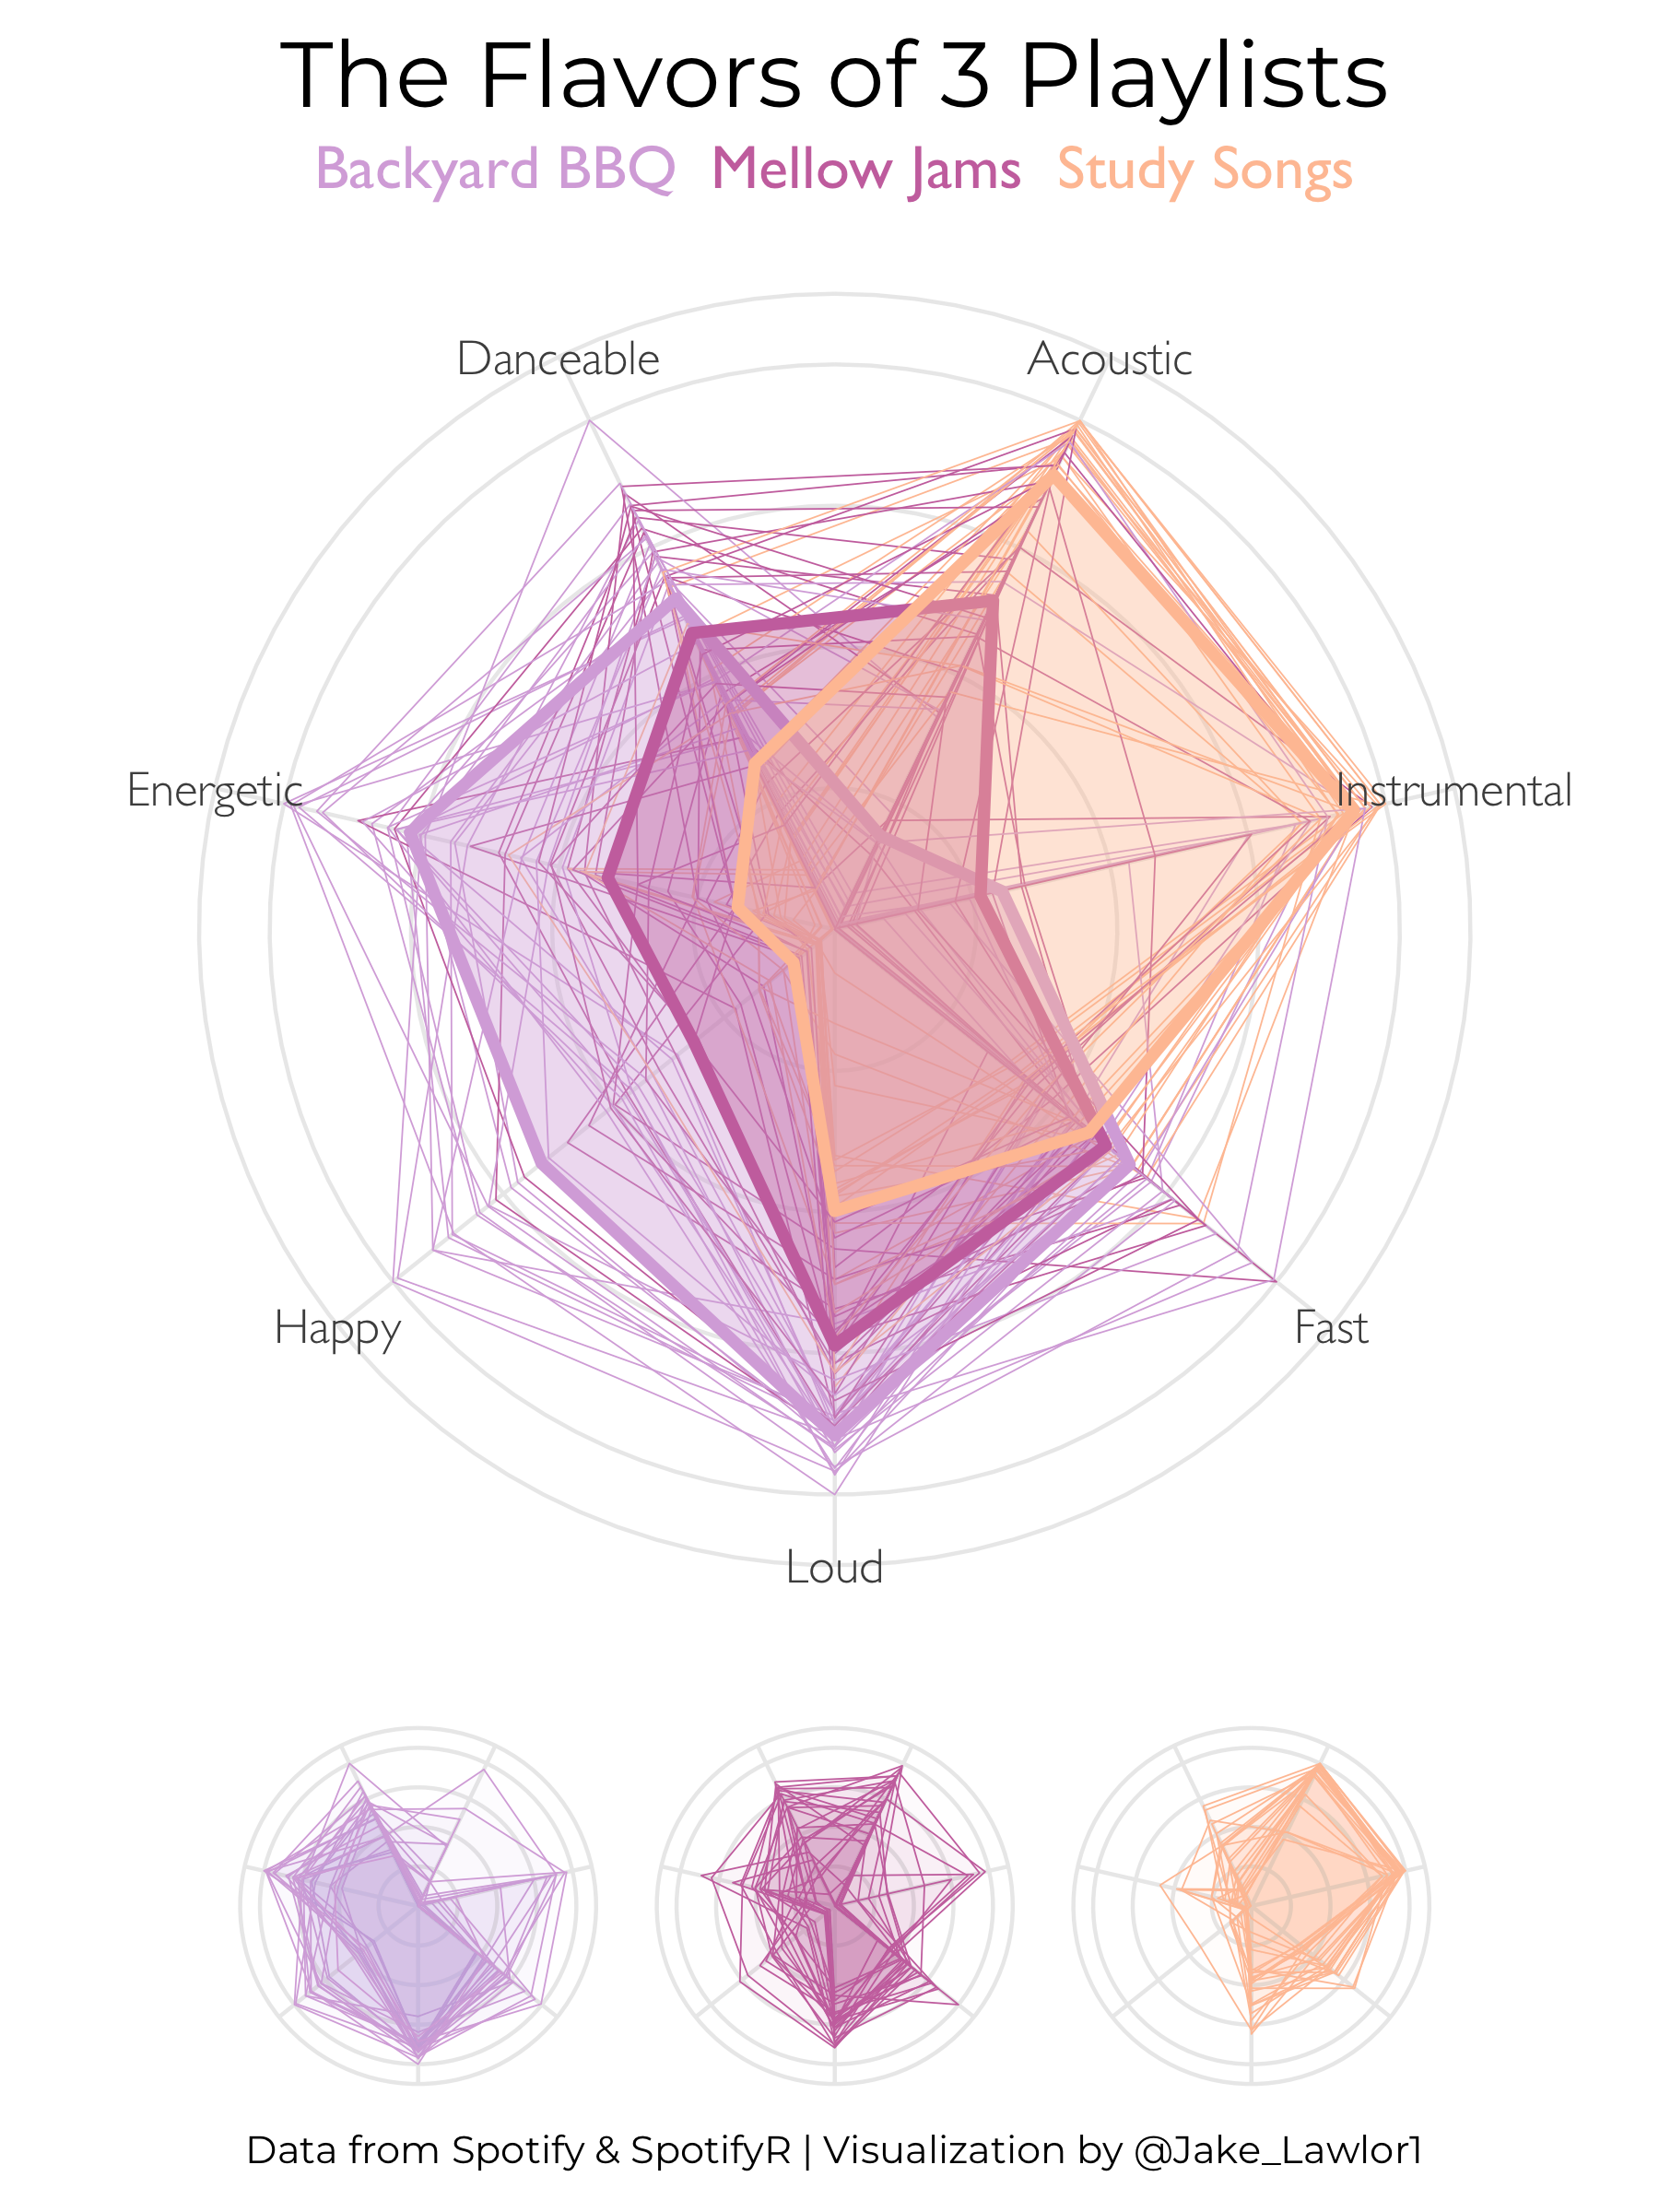
Spotify Playlist Traits
This plot is one of my contributions to the #TidyTuesday R social project. Here, I used the spotifyr package to mine data from my own custom Spotify playlists. I then used a polar web plot to visualize characteristics of sonic traits of songs in each playlist. Code available at link in banner.