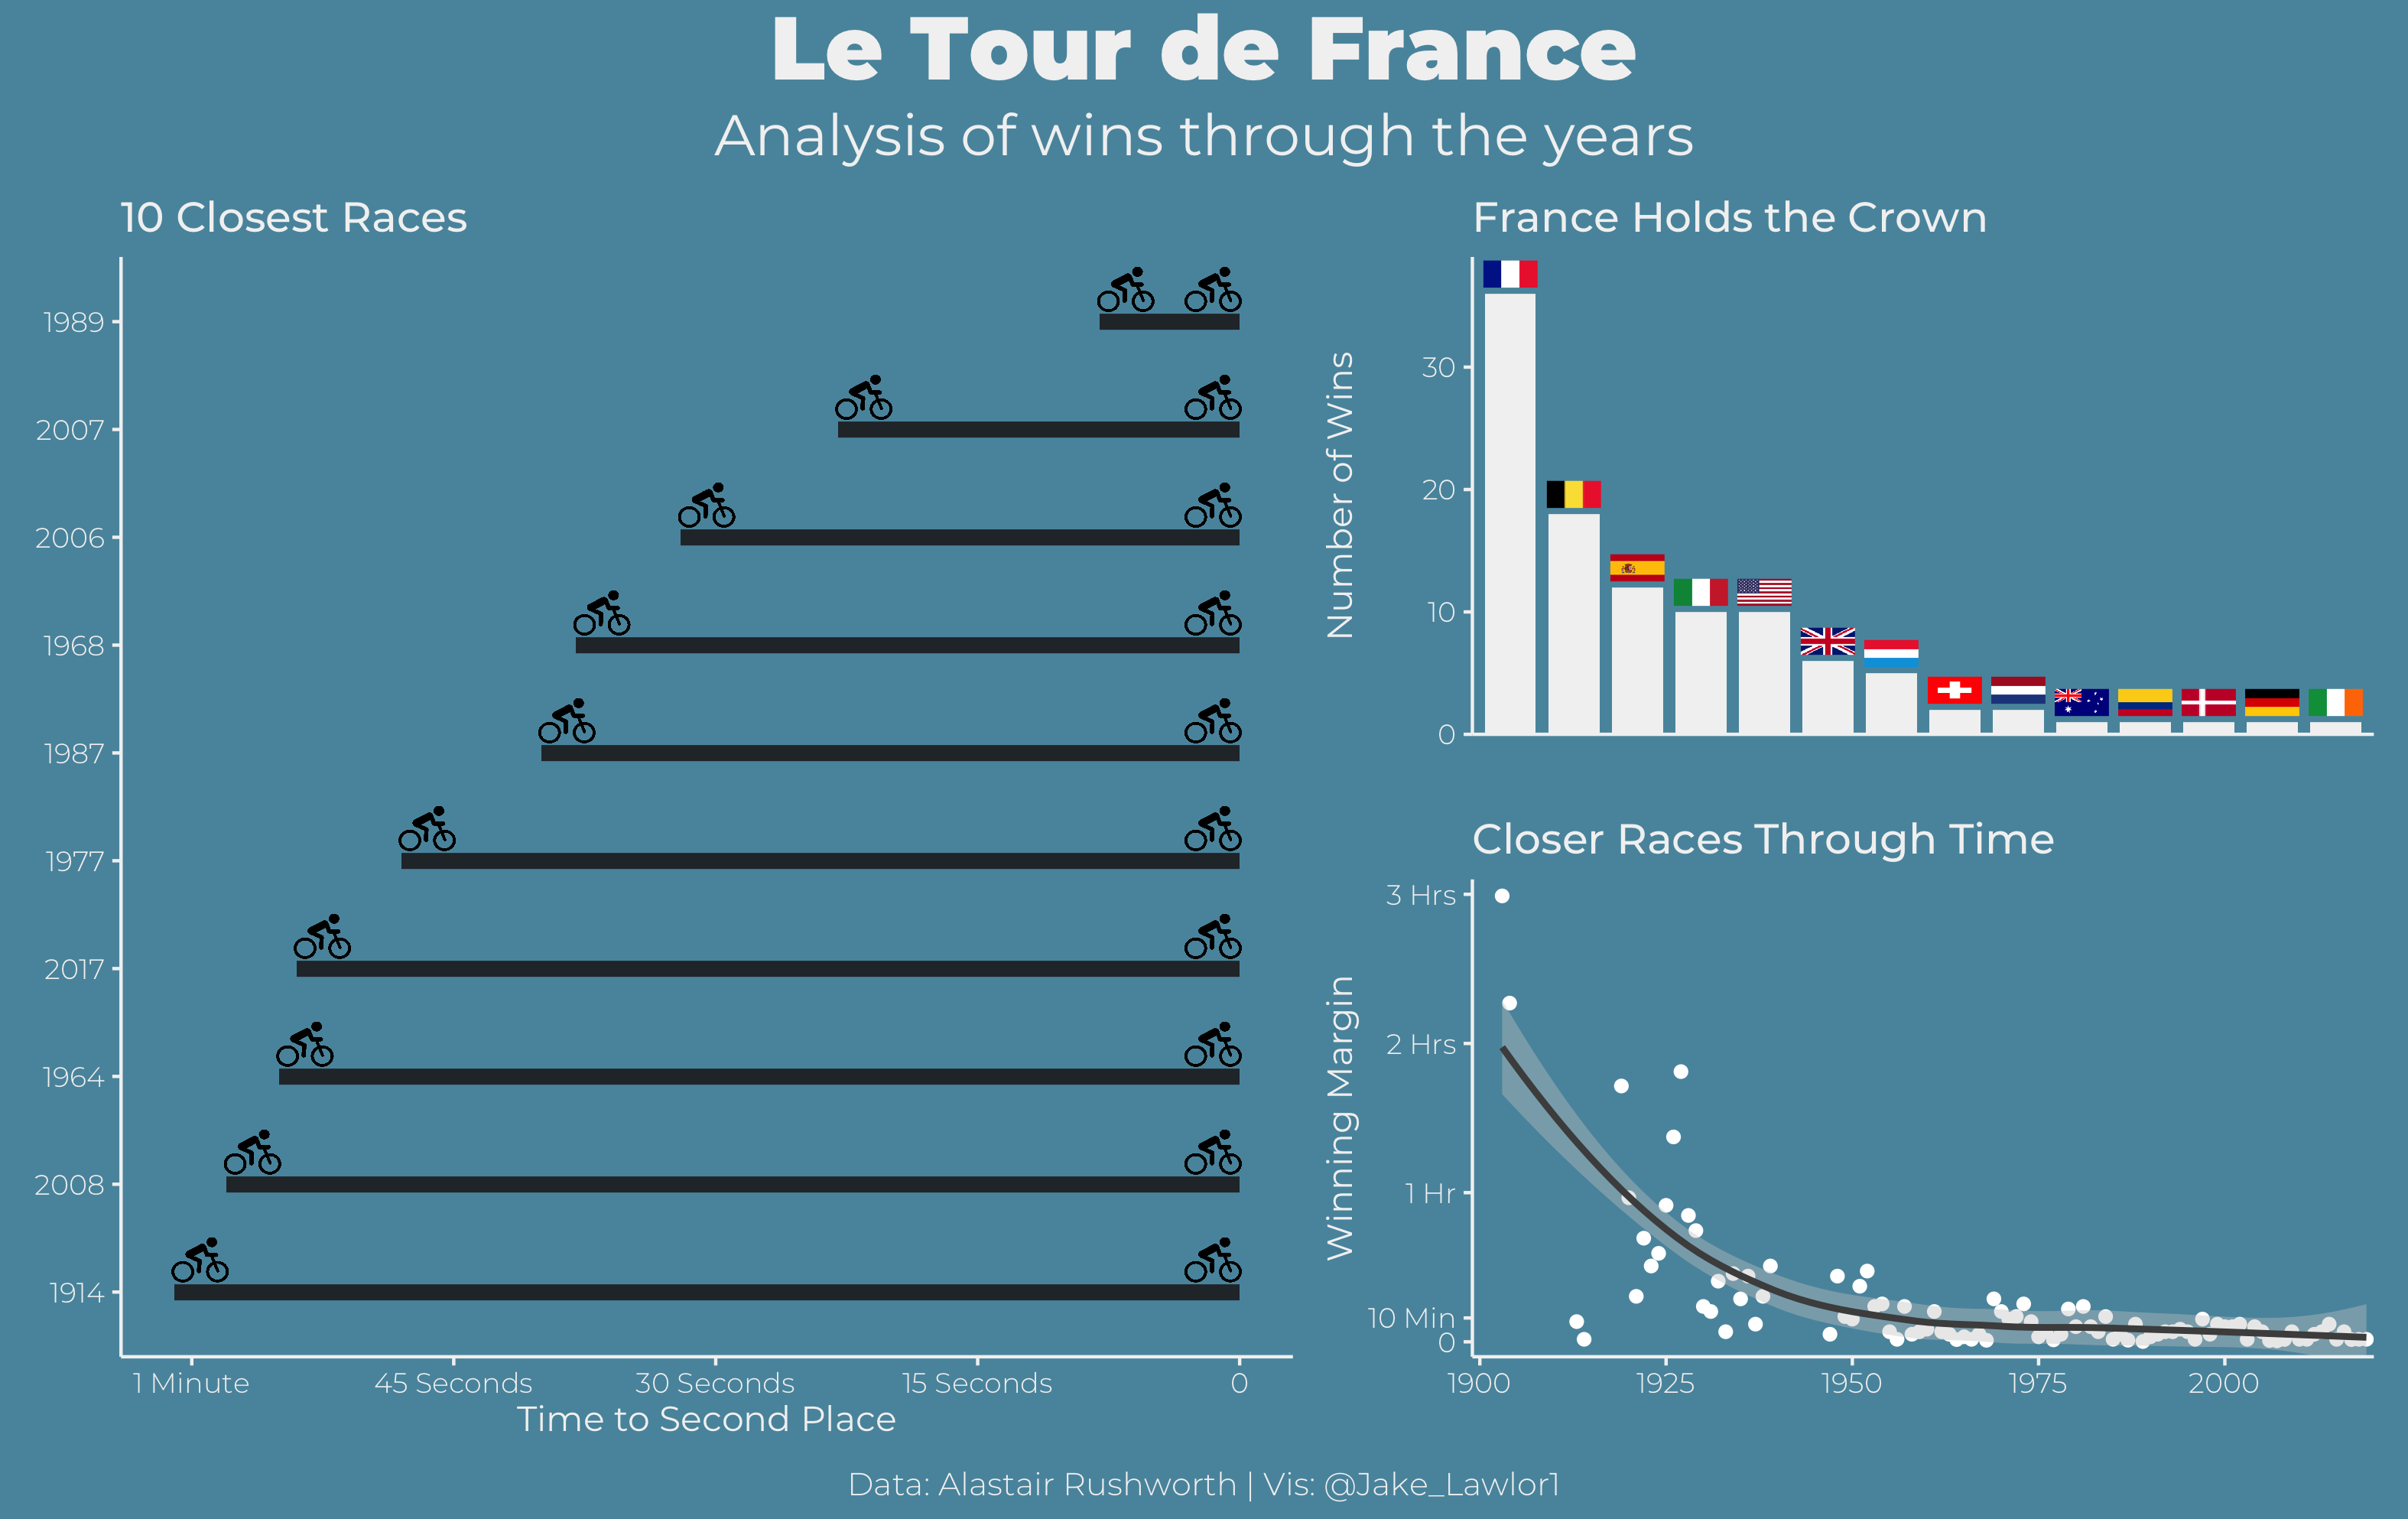
Tour de France winners
This plot is one of my contributions to the #TidyTuesday R social project. Here, I show a dashboard of statistics from ~120 years of Tour de France races. In these plots, I practiced reordering plot factors with the forcats package, and adding png icons to R plots using png and ggimage. Code available at link in banner.