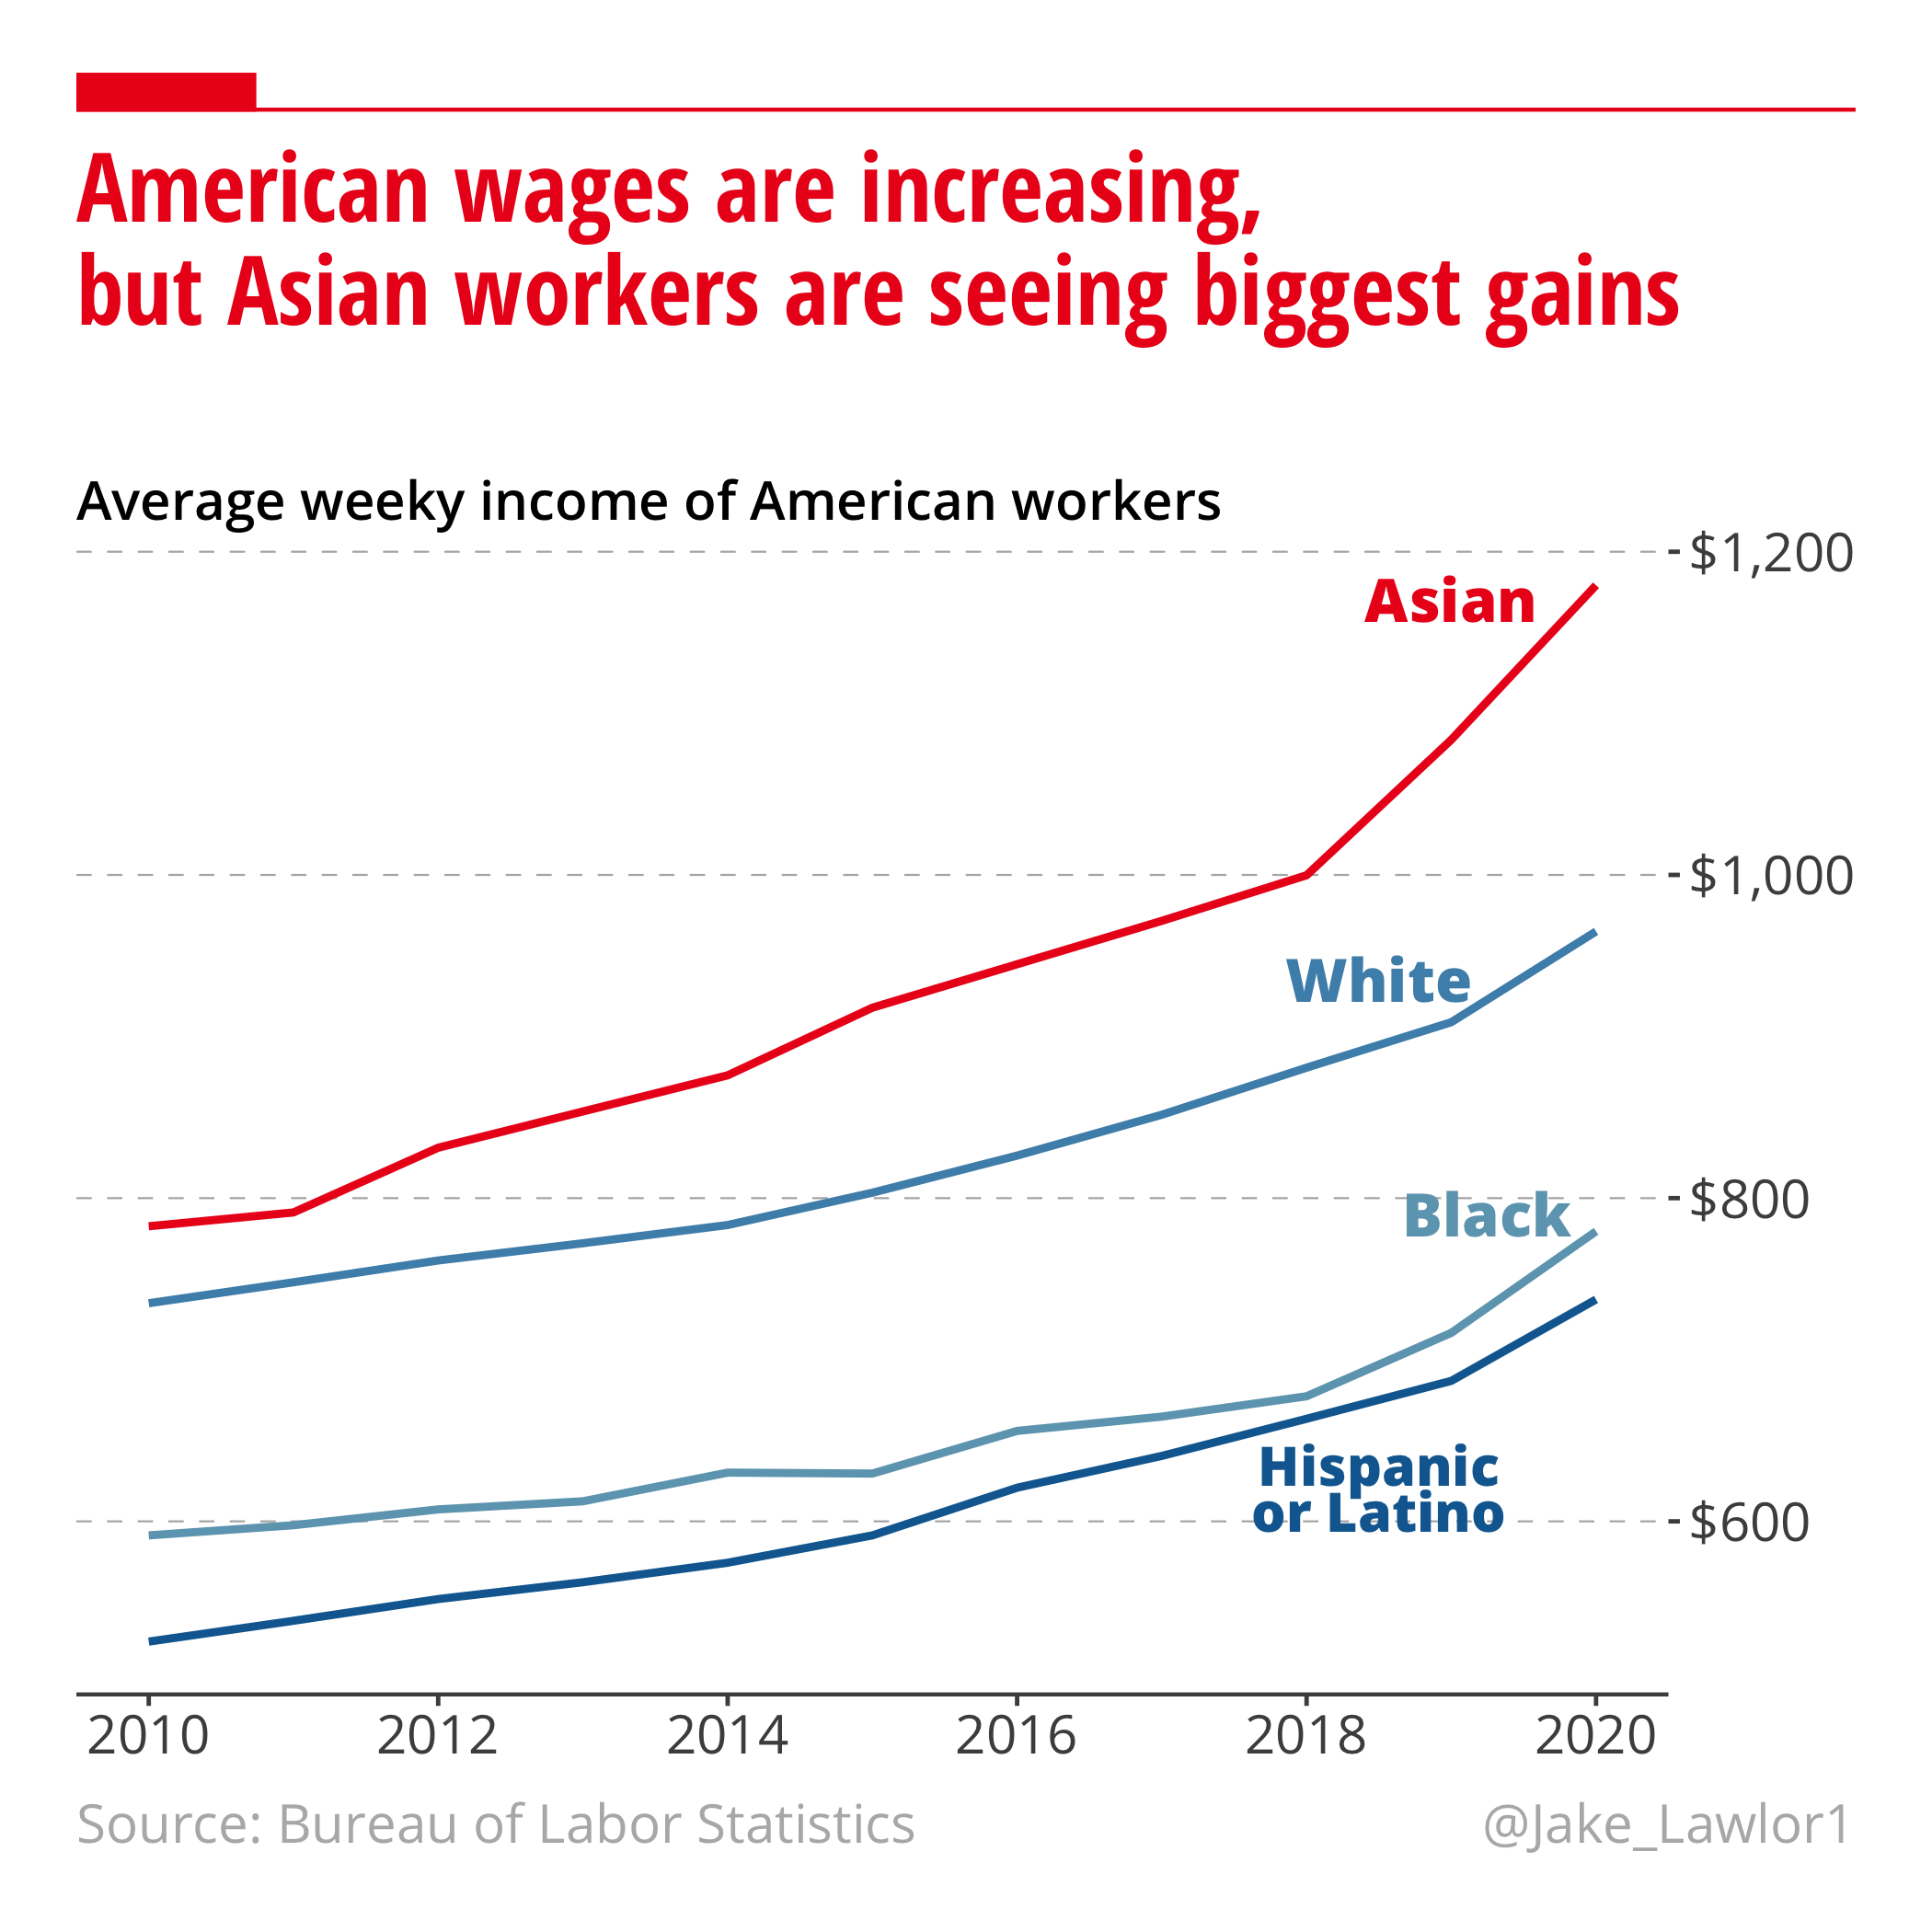
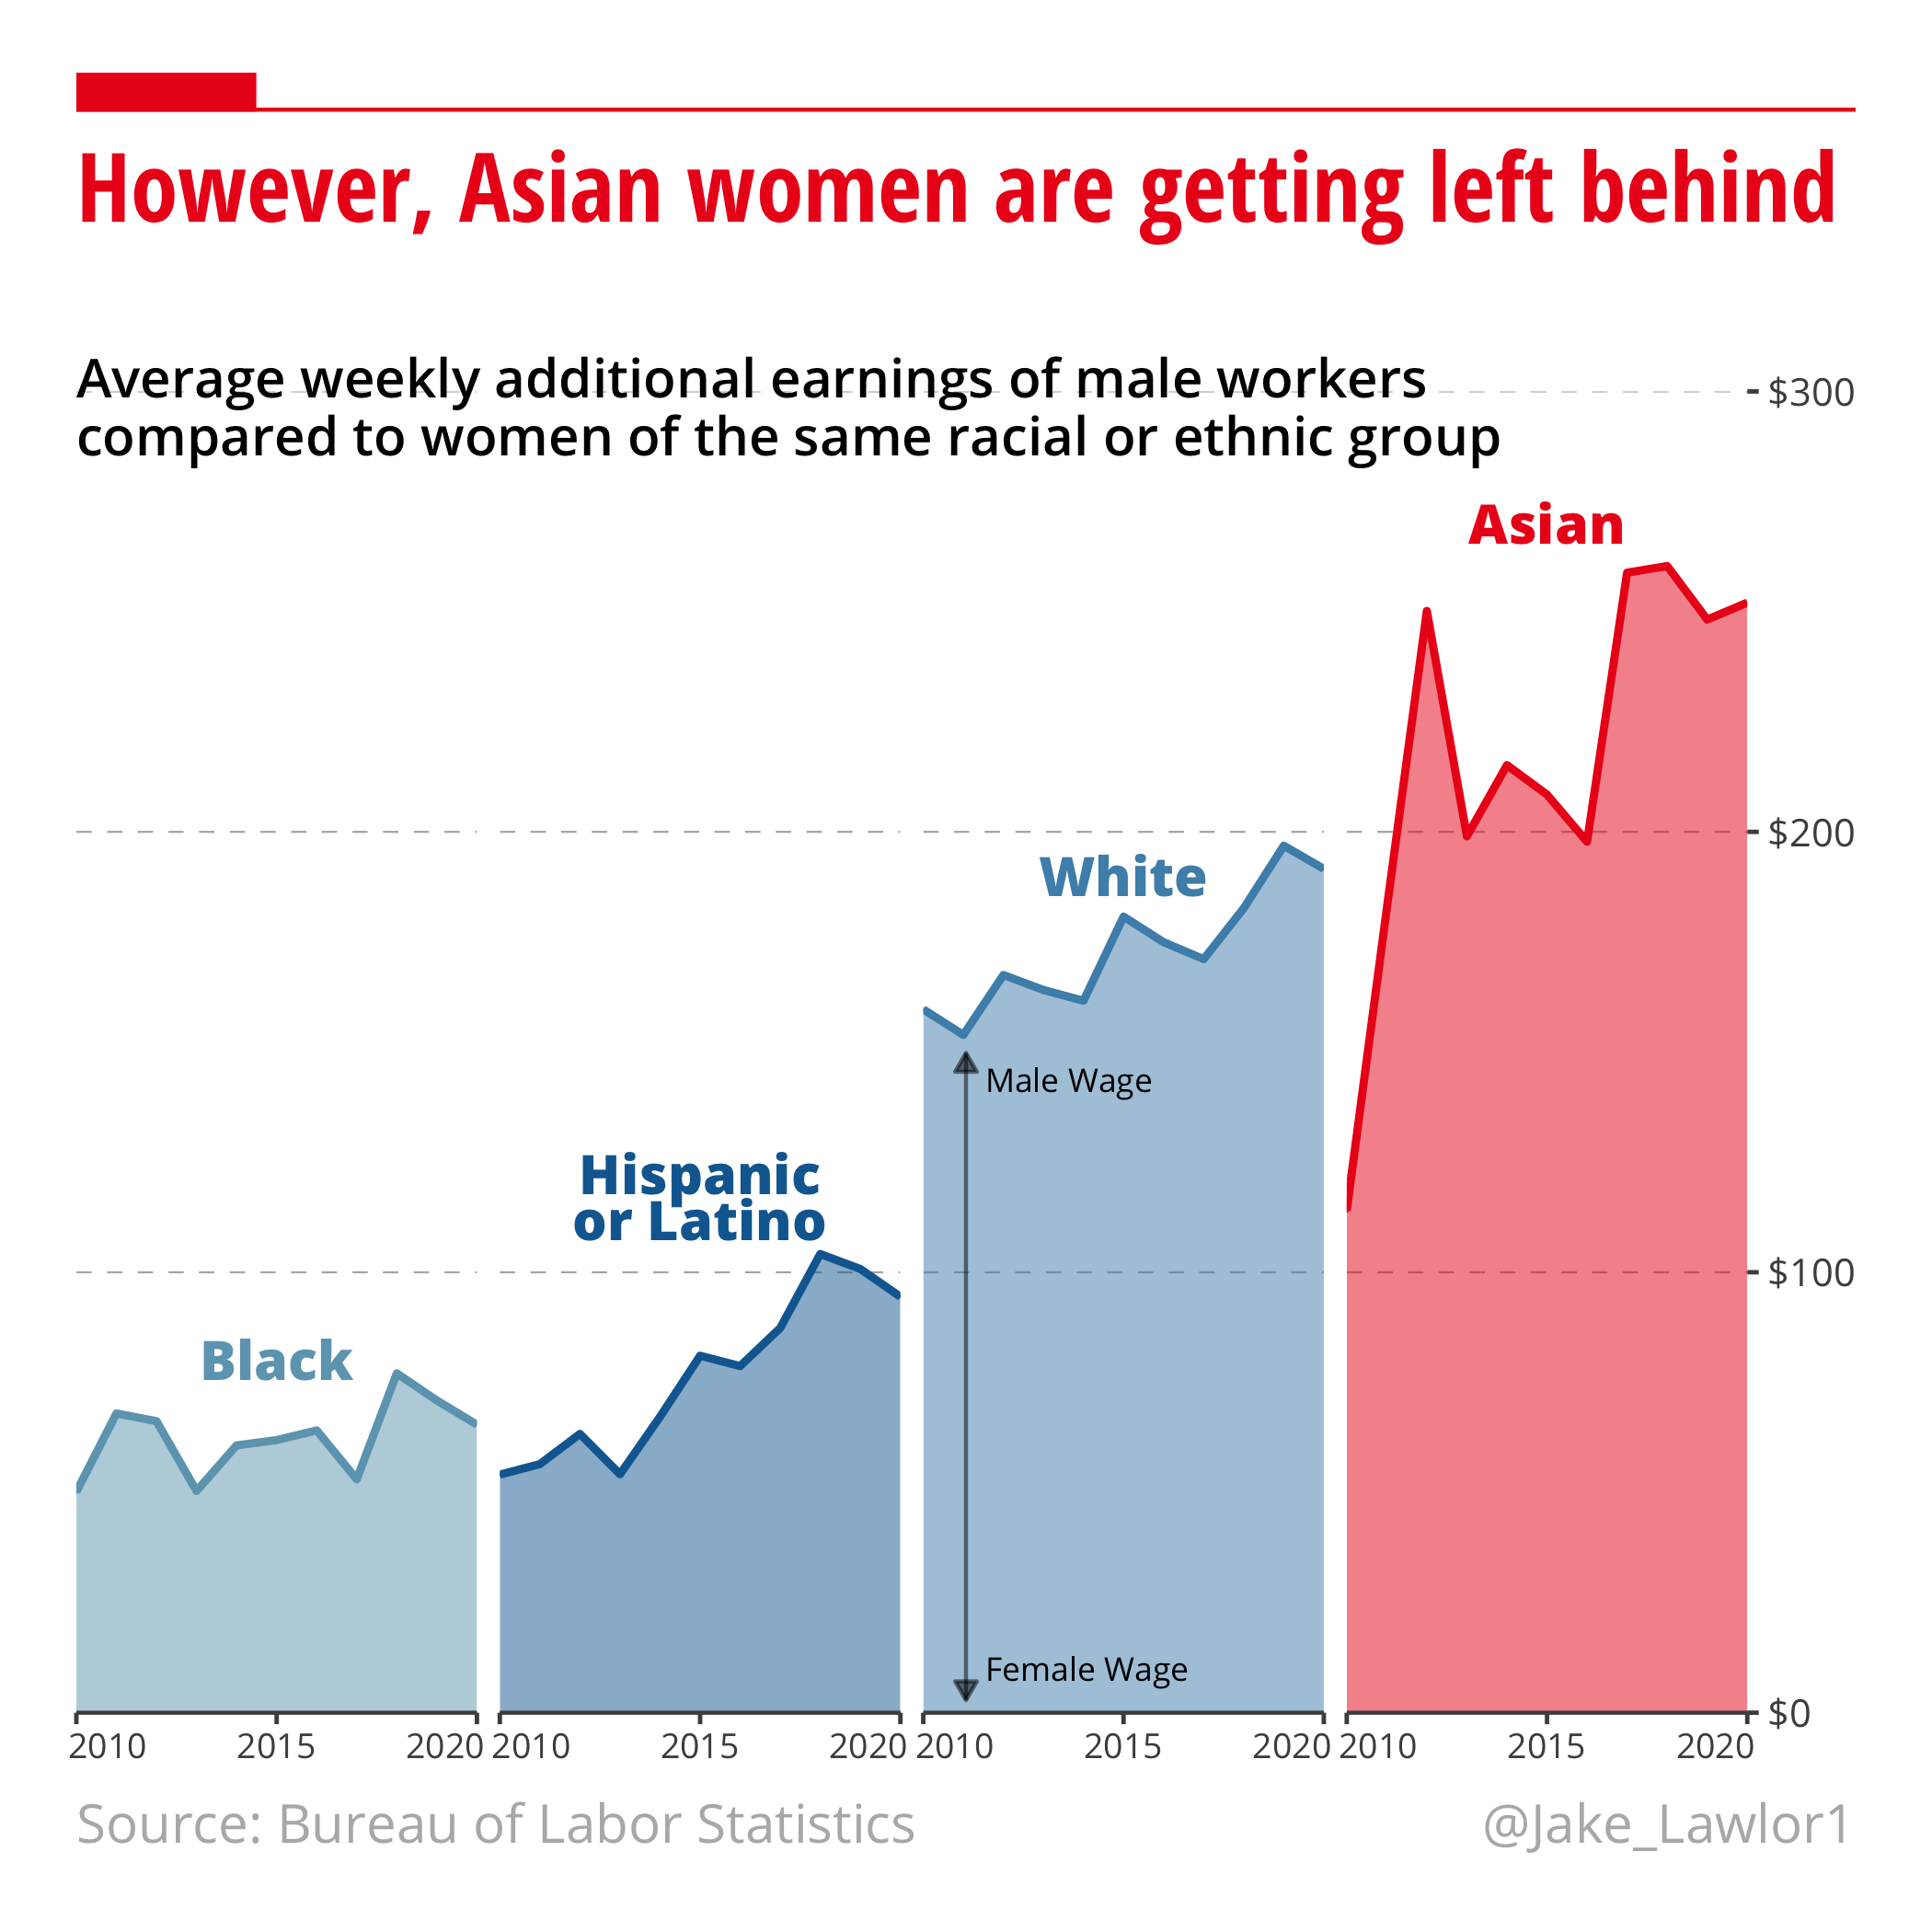
One Decade of American Workers Wages
This plot is one of my contributions to the #TidyTuesday R social project.
Here, I show the changes in wages for American workers by racial and ethnic group, as well as the wage gap between male and female workers. In these plots, I wanted to see if I could replicate the style of one of my biggest data visualization inspirations, The Economist. I used ggplot2 for plots, and cowplot to combine plots with background annotations.